. 2019 Jan 30;10(1):500.
doi: 10.1038/s41467-019-08387-8.

Pluripotency and X chromosome dynamics revealed in pig pre-gastrulating embryos by single cell analysis

Affiliations

Pluripotency and X chromosome dynamics revealed in pig pre-gastrulating embryos by single cell analysis

Priscila Ramos-Ibeas et al. Nat Commun. .

Abstract

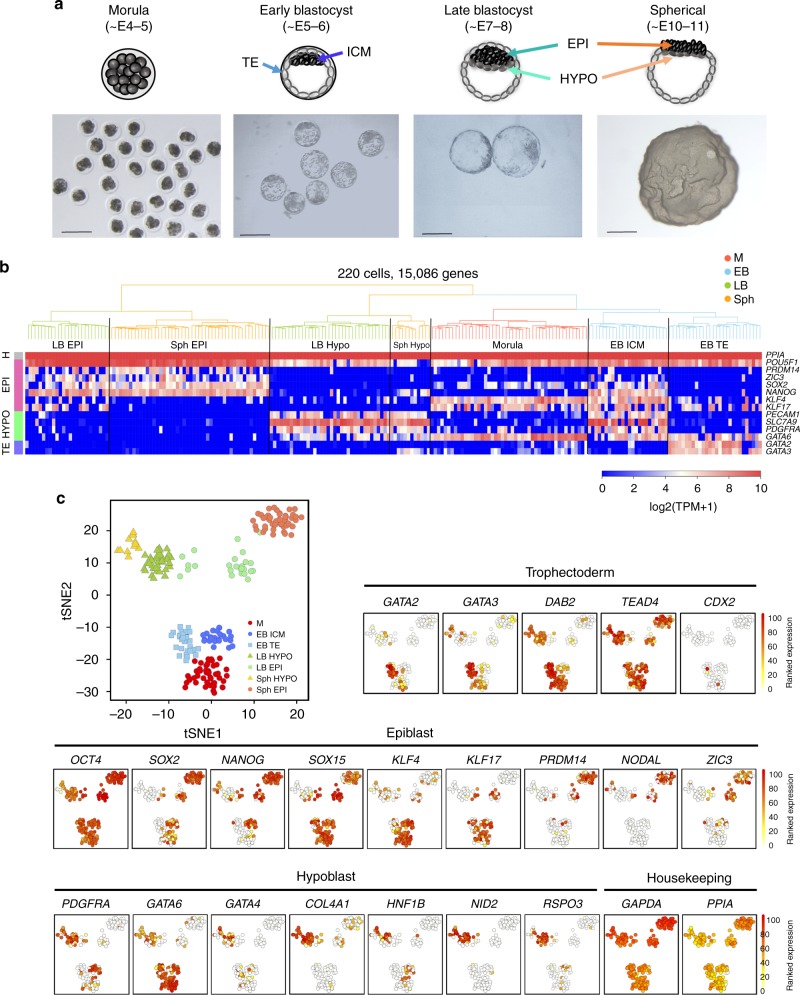
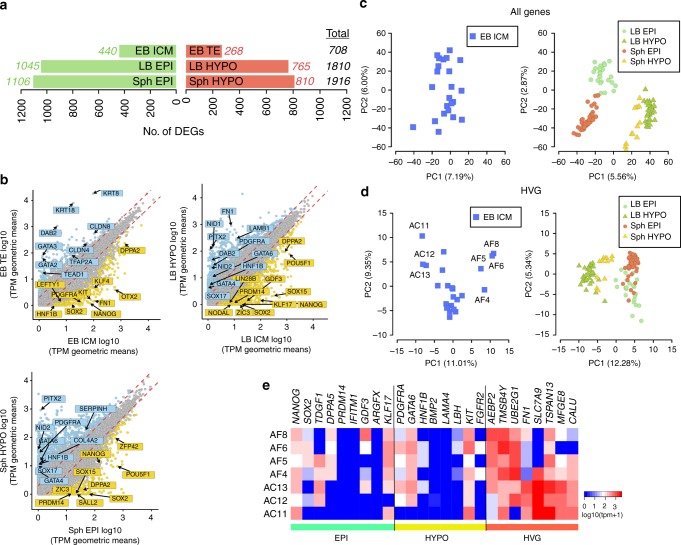
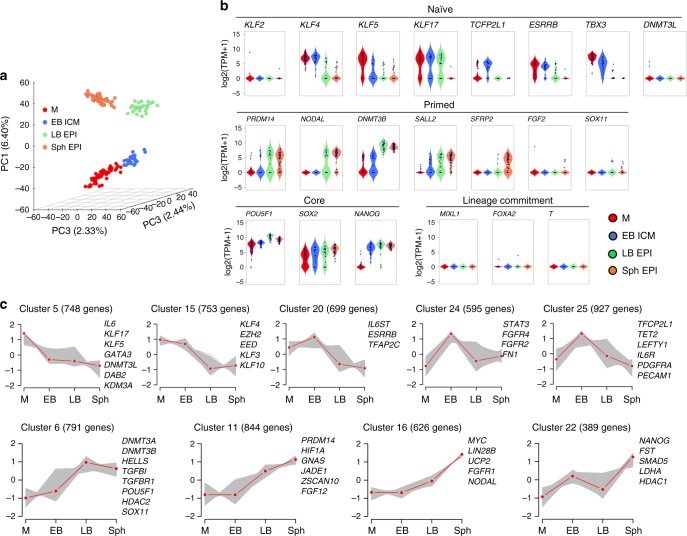
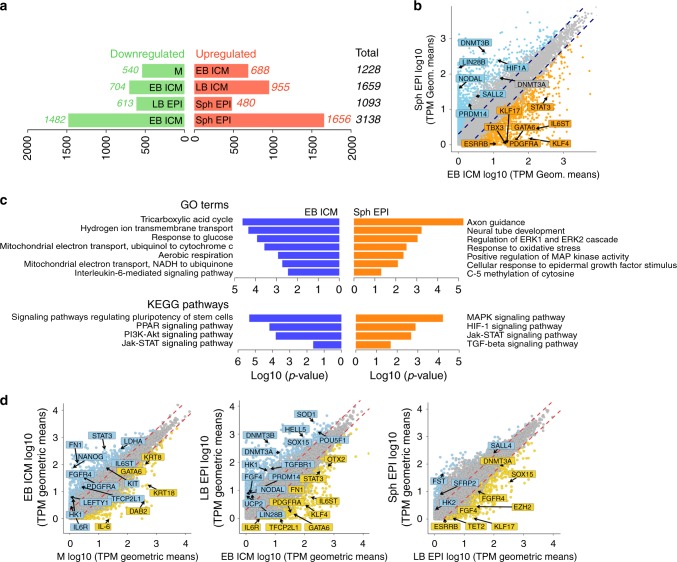
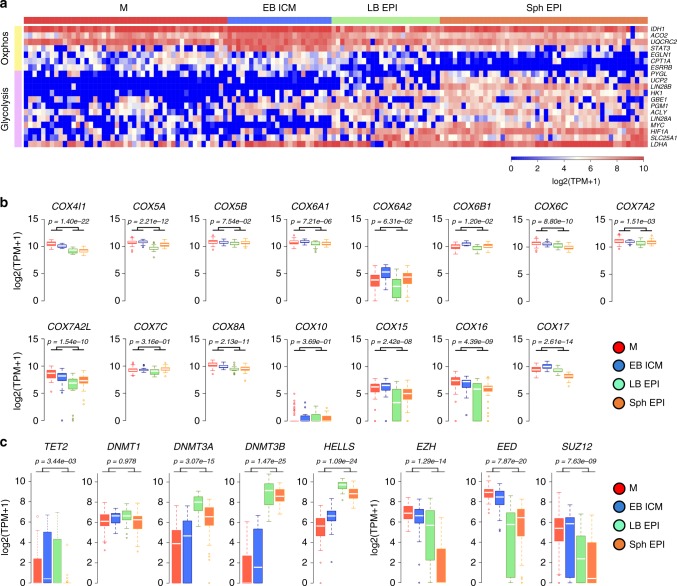
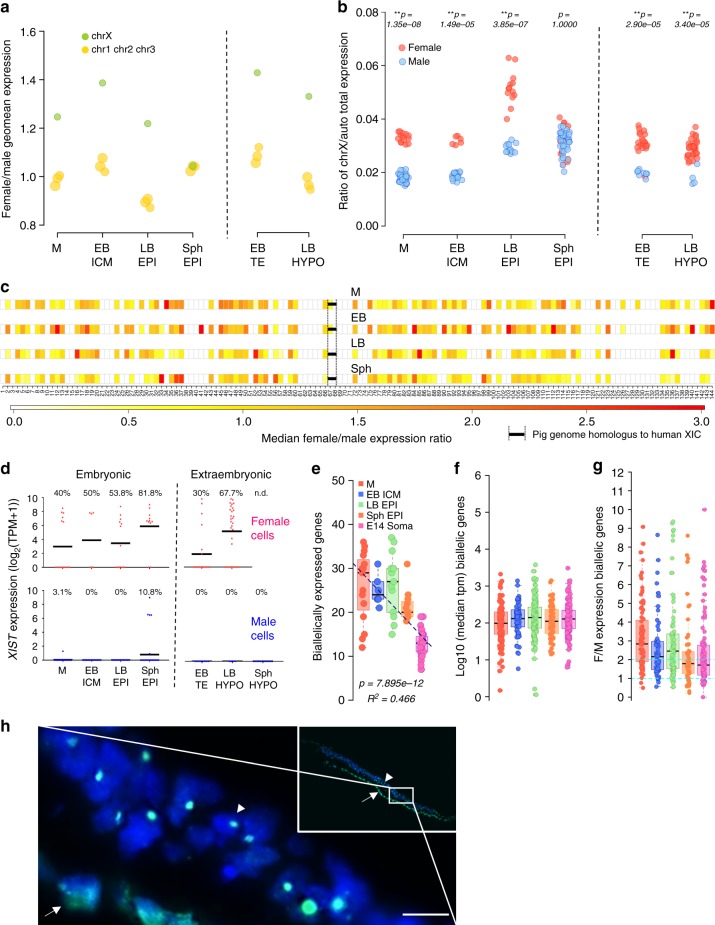
High-resolution molecular programmes delineating the cellular foundations of mammalian embryogenesis have emerged recently. Similar analysis of human embryos is limited to pre-implantation stages, since early post-implantation embryos are largely inaccessible. Notwithstanding, we previously suggested conserved principles of pig and human early development. For further insight on pluripotent states and lineage delineation, we analysed pig embryos at single cell resolution. Here we show progressive segregation of inner cell mass and trophectoderm in early blastocysts, and of epiblast and hypoblast in late blastocysts. We show that following an emergent short naive pluripotent signature in early embryos, there is a protracted appearance of a primed signature in advanced embryonic stages. Dosage compensation with respect to the X-chromosome in females is attained via X-inactivation in late epiblasts. Detailed human-pig comparison is a basis towards comprehending early human development and a foundation for further studies of human pluripotent stem cell differentiation in pig interspecies chimeras.


Conflict of interest statement

The authors declare no competing interests.

Figures

Fig. 1
Fig. 1
Lineage segregation in pig pre-implantation embryos. a Pig pre-implantation embryos collected for scRNA-Seq. b Unsupervised hierarchical clustering (UHC) with all expressed genes (15,086 genes), with a heat map of expression levels of lineage-specific markers. Colours in dendrogram indicate developmental stage. c t-SNE plot of all cells, indicated by colours and shapes for different embryonic days and lineages. Lineage-specific genes are shown in t-SNE plots; a gradient from white to red indicates low to high expression. n = 220 cells. E: embryonic day, M: morula, EB: early blastocyst, LB: late blastocyst, Sph: spherical embryo, EPI: epiblast, HYPO: hypoblast, ICM: inner cell mass, TE: trophectoderm. Scale bar: 300 µm
Fig. 2
Fig. 2
Differential gene expression in cells of the early pig embryo. a Numbers of differentially expressed genes (DEGs) during lineage segregation in pairwise comparisons for each stage. Red and green bars indicate upregulated and downregulated genes, respectively. b Scatter-plot comparisons of the averaged gene expression levels between different lineages (>1 fold change, flanking diagonal lines; Yellow: upregulated, blue: downregulated; log10 (TPM geometric means), key genes are annotated). c PCAs of EB ICM (n = 24 cells) and LB and Sph EPI and HYPO of all expressed genes (n = 121 cells). d PCA of EB ICM (n = 24 cells) and LB and Sph EPI and HYPO cells by highly variable genes (HVG) (n = 121 cells). e Heat map of expression levels of epiblast- and hypoblast-specific markers and HVG in seven selected EB ICM samples from c and d. M: morula, EB: early blastocyst, LB: late blastocyst, Sph: spherical embryo, EPI: epiblast, HYPO: hypoblast, ICM: inner cell mass, TE: trophectoderm
Fig. 3
Fig. 3
Signalling pathways involved in segregation of lineages. a Experimental design of embryo treatments. b Bright field and IF staining for indicated markers; embryos were counterstained with DAPI (merge). Scatter dot plots of NANOG-, SOX17-positive cells and total cell numbers (black bar indicates mean) of control pig morula (M, n = 7), early blastocysts (EB, n = 8), mid-blastocysts (MB, n = 9) and late blastocysts (LB, n = 5). c Bar charts indicating percentage of ICM cells expressing indicated markers in control embryos. d Gene expression of LIF/IL6 and its cognate receptors in pig embryos. e Bar charts indicating percentage of ICM cells expressing indicated markers after different treatments. f Scatter plots show proportion of cells stained for the indicated markers in control embryos (EB n = 8, MB n = 9, LB n = 5) and embryos treated with JAKi: 10 µM AZD1480 (EB n = 11, MB n = 4, LB n = 8), PI3Ki: 10 µM LY294002 (EB n = 7, MB n = 5), TGFβi: 20 µM SB431542 (EB n = 3, MB n = 7, LB n = 7), MEKi: 10 µM PD0325901 (MB n = 7), WNTi: 3 µM IWP2 (MB n = 9), IL6: 10 ng ml−1 (MB n = 8) and TGFβ: 10 ng ml−1 (MB n = 8). g Scatter plots show the number of cells stained in Sham controls (n = 24), homozygous KO (IL6−/−) (n = 9) and mosaic embryos (n = 6) after CRISPR/Cas9 gene editing. ICM cells were determined by counting SOX2 positive cells and TE cells were calculated by subtracting SOX2 cells from the total cell count. Ctr: control, PM: pre-morula. For c, e: *p ≤ 0.05, two-way ANOVA. For f, g: *p ≤ 0.05, Mann–Whitney test. Source data are provided as a Source Data file. Scale bars: 50 µm
Fig. 4
Fig. 4
Progression of pluripotency in the pig embryo: a Principal component analysis (PCA) of the pluripotent lineages (n = 144 cells). b Violin plots of the expression of selected pluripotency and lineage specifier genes. c Self-organising maps (from a total of 25) showing key genes representative of naive and primed pluripotent cells
Fig. 5
Fig. 5
Gene expression changes during progession of pluripotency. a DEGs during the progression of pluripotency. Red and green bars indicate upregulated and downregulated genes, respectively, by pairwise comparisons as indicated. b Scatter-plot of the average gene expression levels between EB ICM vs. Sph EPI (>1 fold change flanking diagonal lines). Upregulated (orange) and downregulated (blue). Key genes are annotated. c Significant gene ontology terms and KEGG pathways in DEGs in the pairwise comparisons. d Scatter-plot comparisons of the averaged gene expression levels between M and EB ICM, EB ICM and LB EPI, and LB EPI and Sph EPI (>1 fold change, flanking diagonal lines; orange: upregulated, blue: downregulated; log10 (TPM geometric means))
Fig. 6
Fig. 6
Surface markers of pig pluripotent cells. a Expression of surface markers in pluripotent lineages. b IF analysis of CD244 in spleen macrophages (positive control) and in early-(EB, n = 12) and mid-blastocysts (MB, n = 5) (scale bar: 10 µm in spleen; 100 µm in embryos). Bar charts showing the proportion of cells within the ICM expressing CD244 only, SOX2 only, and SOX17 only or co-expressing these markers. M: morula, EB: early blastocyst, LB: late blastocyst, Sph: spherical embryo, EPI: epiblast, HYPO: hypoblast, ICM: inner cell mass, TE: trophectoderm
Fig. 7
Fig. 7
Metabolic and epigenetic changes during progression of pluripotency. a Heat map of selected genes involved in OXPHOS and anaerobic glycolysis in pluripotent lineages. b Box plot showing expression of electron transport complex genes and c genes involved in epigenetic modifications. Boxes show 25–75 percentile values and white line shows median gene expression (p < 0.05 by two-sided Wilcoxon test). M: morula (n = 47 cells), EB: early blastocyst (n = 24 cells), LB: late blastocyst (n = 25 cells), Sph: spherical embryo (n = 48 cells), EPI: epiblast, ICM: inner cell mass
Fig. 8
Fig. 8
Dosage compensation for the female X-chromosome. a Ratio of gene expression between female and male embryos for the X-chromosome vs. autosomes 1, 2 and 3. b Proportion of total expression levels of the X-chromosome relative to autosomes at the single-cell level. **p ≤ 0.01, two-sided Wilcoxon test. c Female-to-male expression average along the X-chromosome. XIC: X-inactivation centre. d XIST expression level in male and female cells (black line indicates mean expression). Percentage of cells with TPM > 1 is shown. e Number of biallelically expressed genes in each cell at different stages of development. Linear regression used to determine trend line. f Median expression of bi-allelic genes. g Female-to-male ratio of expression of genes biallelically expressed in females. Boxes show 25–75 percentile data points and black line shows median values (eg). Light blue lines (g) depict values 1 and 2 across the dataset. h IF staining of H3K27me3  (green) merged with DAPI (blue)  in sectioned spherical female embryo. Arrow indicates hypoblast and arrowhead marks the epiblast. Inset shows a low magnification image of the embryonic disc. Scale bar: 10 µm. M: morula, EB: early blastocyst, LB: late blastocyst, Sph: spherical embryo, EPI: epiblast, ICM: inner cell mass, HYPO: hypoblast
Fig. 9
Fig. 9
Comparison of pig, mouse and human matched pluripotent states. a PCA of pig and mouse orthologous genes expressed in pluripotent cells. b PCA of pig and human orthologous genes expressed in embryonic cells and hESCs. c Summary of key events in the pluripotent compartment of the pig embryo. E: embryonic day, M: morula, EB: early blastocyst, LB: late blastocyst, Sph: spherical embryo, EPI: epiblast, HYPO: hypoblast, ICM: inner cell mass, TE: trophectoderm

Similar articles

Cited by

References

    1. Rossant J. Mouse and human blastocyst-derived stem cells: vive les differences. Development. 2015;142:9–12. doi: 10.1242/dev.115451. - DOI - PubMed
    1. Nakamura T, et al. A developmental coordinate of pluripotency among mice, monkeys and humans. Nature. 2016;537:57–62. doi: 10.1038/nature19096. - DOI - PubMed
    1. Okamoto I, et al. Eutherian mammals use diverse strategies to initiate X-chromosome inactivation during development. Nature. 2011;472:370–374. doi: 10.1038/nature09872. - DOI - PubMed
    1. Shahbazi MN, et al. Self-organization of the human embryo in the absence of maternal tissues. Nat. Cell Biol. 2016;18:700–708. doi: 10.1038/ncb3347. - DOI - PMC - PubMed
    1. Deglincerti A, et al. Self-organization of the in vitro attached human embryo. Nature. 2016;533:251–254. doi: 10.1038/nature17948. - DOI - PubMed

Publication types