. 2019 Jan 30;9(1):1007.
doi: 10.1038/s41598-018-36999-5.

Age-related differences in the bone marrow stem cell niche generate specialized microenvironments for the distinct regulation of normal hematopoietic and leukemia stem cells

Affiliations

Age-related differences in the bone marrow stem cell niche generate specialized microenvironments for the distinct regulation of normal hematopoietic and leukemia stem cells

Ga-Young Lee et al. Sci Rep. .

Abstract

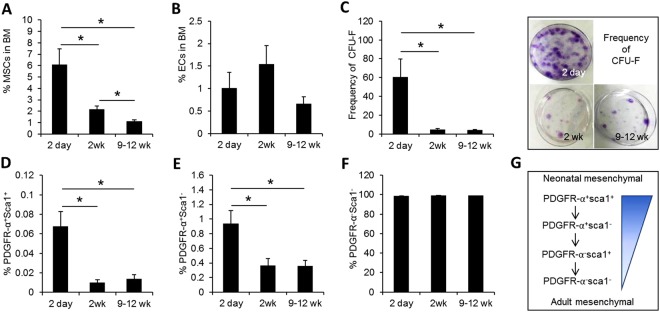
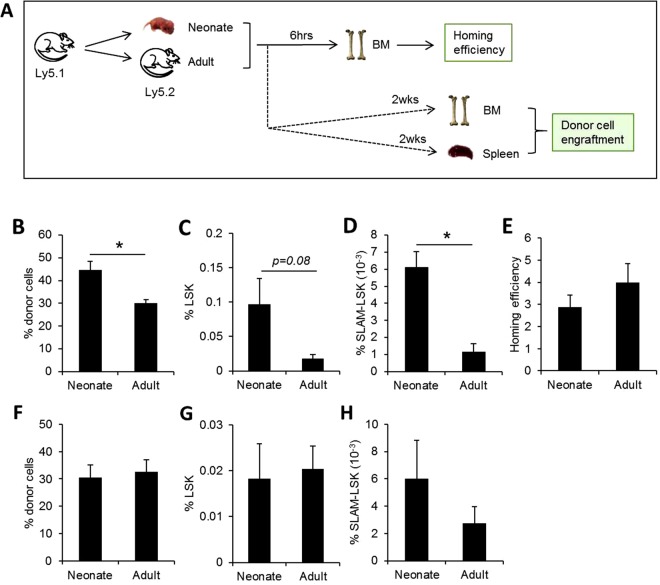
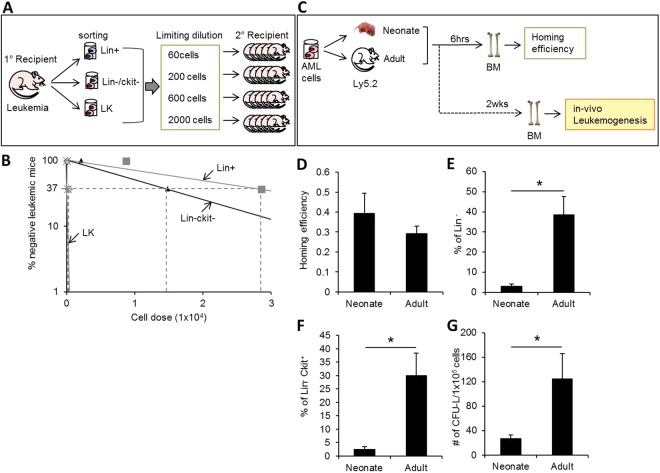
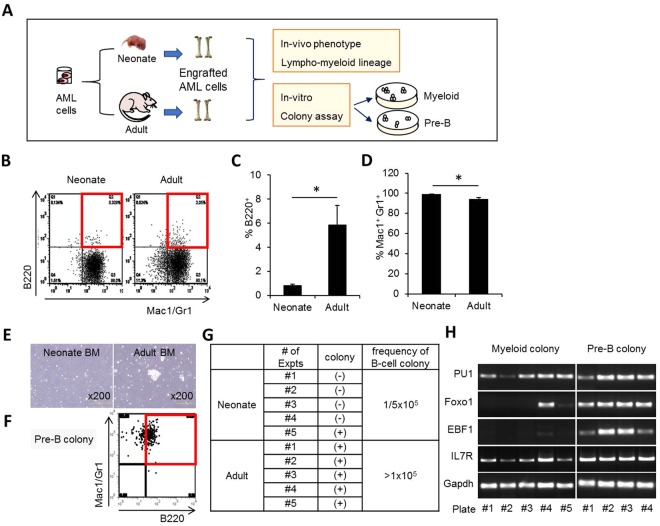
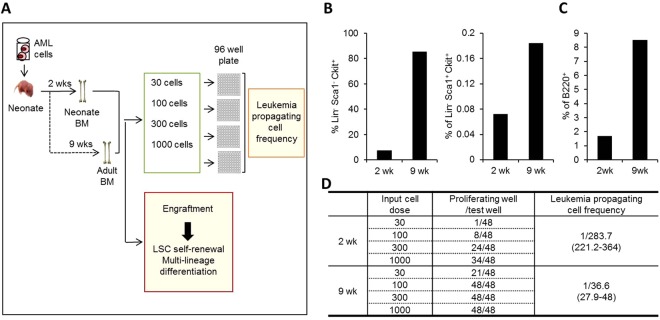
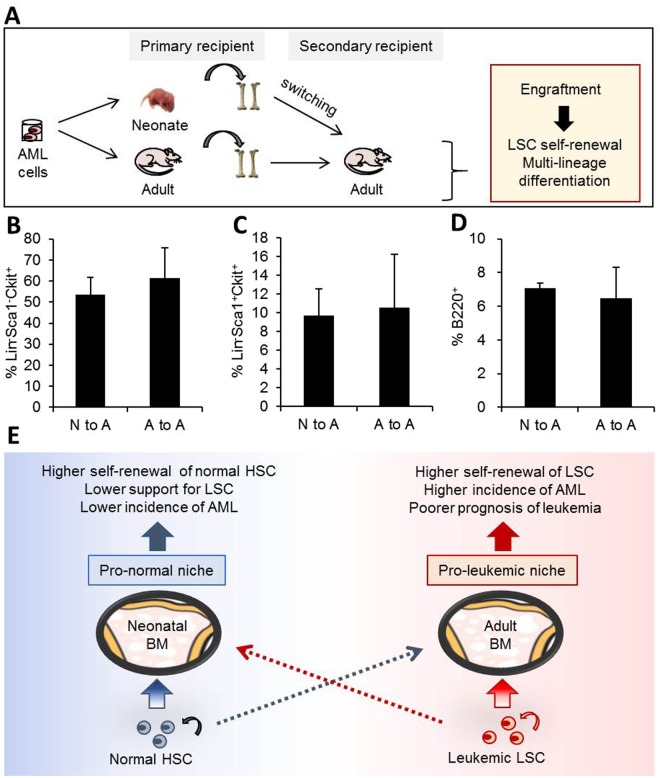
The bone marrow (BM) microenvironment serves as a stem cell niche regulating the in vivo cell fate of normal hematopoietic stem cells (HSC) as well as leukemia stem cells (LSCs). Accumulating studies have indicated that the regeneration of normal HSCs and the process of leukemogenesis change with advancing age. However, the role of microenvironmental factors in these age-related effects are unclear. Here, we compared the stem cell niche in neonatal and adult BM to investigate potential differences in their microenvironmental regulation of both normal and leukemic stem cells. We found that the mesenchymal niche in neonatal BM, compared to adult BM, was characterized by a higher frequency of primitive subsets of mesenchymal stroma expressing both platelet-derived growth factor receptor and Sca-1, and higher expression levels of the niche cross-talk molecules, Jagged-1 and CXCL-12. Accordingly, normal HSCs transplanted into neonatal mice exhibited higher levels of regeneration in BM, with no difference in homing efficiency or splenic engraftment compared to adult BM. In contrast, in vivo self-renewal of LSCs was higher in adult BM than in neonatal BM, with increased frequencies of leukemia-initiating cells as well as higher lympho-myeloid differentiation potential towards biphenotypic leukemic cells. These differences in LSC self-renewal capacity between neonates and adults was abrogated by switching of recipients, confirming their microenvironmental origin. Our study provides insight into the differences in leukemic diseases observed in childhood and adults, and is important for interpretation of many transplantation studies involving neonatal animal models.


Conflict of interest statement

The authors declare no competing interests.

Figures

Figure 1
Figure 1
Age-related differences in stromal cell composition of BM. (A,B) Cellular composition of stromal cells in BM were compared for mice at indicated ages. Shown are the % of mesenchymal stroma (A) and endothelial cells (B) at 2 days, 2 weeks, and 9–12 weeks after birth (Mean ± SEM, n = 5 for 2 days, n = 10 for 2 weeks, n = 16 for 9–12 weeks, from 7 expts). (C) Comparisons of frequencies of clonogenic mesenchymal cells (CFU-F) in neonate and adult BM. Shown are the numbers of CFU-F obtained by plating 5 × 106 BMCs and representative photographs of colonies visualized by crystal violet staining (Mean ± SEM, n = 3 for day2, n = 8 for 2 weeks, n = 13 for 9–12 weeks, from 6 expts, *p < 0.05). (DG) Difference in the composition of mesenchymal subsets among total mesenchymal stroma in BM. Shown are % of most primitive PDGFR + Sca-1+ (D), intermediate PDGFR + Sca1− (E), and mature PDGFR-Sca1− (F), subsets among the total mesenchymal population (CD45-Ter119-CD31−) (Mean ± SEM, n = 5 for day 2, n = 10 for 2 weeks, n = 16 for 9–12 weeks, from 7 expts). (G) Schematic illustration of hierarchical organization of MSC subsets.
Figure 2
Figure 2
Difference in the expression levels of niche cross-talk molecules in mesenchymal stroma of neonate and adult BM. (AD) Adult and neonatal (postnatal day2) BM stromal cells were compared for expression levels of CXCL-12 and Jagged-1. Shown are the representative flow cytometry profiles for intracellular staining and quantification of CXCL-12 (A,B) and Jagged-1 (C,D) in mesenchymal stroma (CD45-Ter119-CD31−) of BM (Mean ± SEM, n = 7 for neonate, n = 6 for adult, from 2expts). (E,F) Functional influence of niche cross-talk molecules on in-vivo hematopoietic activity. Mice were injected with chemical inhibitors of CXCL-12 (AMD3100) and notch ligand (DAPT) 4 times every two days and 2weeks later resulting changes of BM in the % of HSCs (SLAM-LSK) or multiple progenitors (LSKCD150-CD41/48−) were analyzed (Mean ± SEM, n = 6-7, 2expts, *p < 0.05). (G) Effects of Jagged-1 knock down in MSCs on in-vitro self-renwal of hematopoietic progenitor cells. MSCs transfected with siRNA against Jagged-1 or non-target RNA were co-cultured with progenitor-enriched hematopoietic cells. Shown are the % of LSKhigh population in hematopoietic cells after 5 days of co-culture with each indicated MSCs (Mean ± SEM, n = 6, from 2 expts, *p < 0.05).
Figure 3
Figure 3
In vivo repopulation of normal hematopoietic cells in neonatal and adult recipients. (A) Schematic illustration of experimental scheme. Bone marrow cells (BMCs) from the donor mice (Ly5.1) were transplanted into irradiated neonate (postnatal 2 day) or adult (9–12 weeks) recipients (Ly5.2). Homing efficiency and engraftment of transplanted cells were analyzed 6 hours and 2 weeks after transplantation, respectively. (BD) Engraftment of donor-derived cells in BM of neonate and adult mice were compared. Shown are the mean ± SEM of % engraftment of donor-derived cells (B), and % hematopoietic stem cells (HSCs) among donor cells defined by LSK and SLAM-LSK (CD150 + 41-48-Lin-Sca-1 + c-Kit+) (C,D) (n = 5, from 2 expts, *p < 0.05). (E). Homing efficiency of transplanted donor BMCs into neonate and adult BM. % donor-derived cells in BM of neonate and adult mice 6 hours after transplantation are shown (Mean ± SEM, n = 3 for neonate, n = 4 for adult mice, 2expts). (FH) Splenic engraftment of normal HSCs. % engraftment of donor-derived hematopoietic cells (F) and % of HSCs (LSK or SLAM-LSK) among donor cells (G,H) in spleen are shown. (Mean ± SEM, n = 7, from 3 expts).
Figure 4
Figure 4
Comparison of in vivo leukemogenic activity between neonate and adult BM. (A) Schematic illustration of the experimental design for Identification of leukemia-initiating cell subpopulations in acute myeloid leukemia (AML) by limiting dilution analysis. 5-FU BMCs were transduced with retrovirus encoding the MN1 oncogene to induce leukemia. Two weeks after transplanting AML cells into recipient mice, the heterogenous leukemic cell population generated in the BM of leukemic mice were sort purified by phenotype and subjected to limiting dilution analysis (LDA) into secondary recipients to measure the frequency of leukemia-initiating cells (LIC) at post-transplantation 2 weeks. (B) Frequency of LIC in each purified subset of leukemia cells in LDA plots calculated by Poisson’s statics. (C) Schematic illustration of experimental design for comparing leukemogenic activity. Acute myeloid leukemia (AML) cells induced by MN1 were transplanted into mice and their homing and leukemic engraftment was analyzed at 6 hrs (homing) and 2 weeks (engraftment) after transplantation. (D) Comparisons of homing efficiency into BM. Shown are the % of leukemic cells in recipient BMs (Mean ± SEM, n = 4 for each group, from 2expts). (E,F). Analysis of in vivo generation of LSCs in leukemic recipient mice. Shown are the % engraftment of each subset of leukemic cells in mice (Mean ± SEM, n = 13 for neonatal group, n = 6 for adult group, from 5 expts). (G). Numbers of clonogenic leukemic cells (CFU-L) from 1 × 105 of leukemic cells (GFP+) engrafted in neonate and adult BMs (Mean ± SEM, n = 15 for neonate, n = 8 for adult, from 3 expts, *p < 0.05).
Figure 5
Figure 5
Multi-lineage potential of leukemic cells in adult BM. (A) Schematic illustration of experimental design. After transplanting adult or neonatal mice with leukemic cells. The leukemic cells (GFP+) engrafted in neonatal or adult BM were analyzed for phenotype by flow cytometry and plated for myeloid or pre-B-cell colony formation. (B) Representative flow cytometry plots for lineage distribution (myeloid: Mac-1/Gr-1+ vs. B-lymphoid: B220+/Mac-1/Gr-1+). (C,D) Percent of biphenotypic B-lymphoid (B220/Mac-1/Gr-1)) (C) and myeloid cells (Mac-1/Gr-1) (D) among engrafted GFP+ cells are shown (Mean ± SEM, n = 13 for neonatal group, n = 6 for adult group, from 5 expts). (EG) B220+ colonies generated from BM leukemic cells engrafted in neonate and adult BM. Shown are representative photographs of colonies formed in pre-B-cell colony assay (E) and phenotypes of individual colonies analyzed by flow cytometry (F). (G) frequencies of positive B-lymphoid colonies from 1 × 105 (GFP+) plated cells (2 expts, n = 5 for each group). (H) Expression of B-cell specific genes in colonies formed in pre-B-cell colony assay. The colonies generated in myeloid or pre-B-cell colony assay from BM engrafted leukemic cells were analyzed for indicated B-cell specific genes by RT-PCR. Note selective expression of B-cell specific genes in pre-B-cell colonies.
Figure 6
Figure 6
Time-lapse changes of leukemic cell with aging of BM microenvironment. (A) Schematic illustration of experimental design. Leukemic cells were transplanted into neonate and examined for multi-lineage differentiation and self-renewal of LSCs with aging of recipient BM at 2 weeks and 9 weeks after transplantation. (B,C) Changes in the frequencies of primitive leukemic population (Lin-Sca-1-c-Kit+ or Lin-Sca-1 + c-Kit+) (B) and B220+ leukemic cells (C). Shown are the mean % of each subset among BM engrafted leukemic cells (n = 2, from 1 expt). (D) Changes in frequency of leukemia-propagating cells determined by in-vitro limiting dilution assay.
Figure 7
Figure 7
Microenvironmental origin of the ontological difference in leukemogenic activity. (A) Schematic illustration of experimental design. Leukemic cells were transplanted into neonate and adult mice. Two weeks after transplantation, the leukemic cells engrafted in primary recipients were subjected to switching transplantation into adult recipients to compare in vivo generation of LSCs and multi-lineage differentiation into B-cells (post-transplantation 2 weeks). (BD) Percent of Lin-Sca-1-c-Kit+ (B), Lin-Sca-1 + c-Kit+ (C), and B220+ leukemic cells (D) among leukemic cells in switched secondary recipients are shown (Mean ± SEM, n = 4). (E) Schematic summary of the age-related differences in the neonatal BM microenvironment compared with the adult BM. The neonatal BM niche is characterized by higher frequencies of primitive mesenchymal subsets and higher levels of niche cross-talk. The neonatal niche provides a microenvironment for enhanced regeneration of normal HSCs, whereas adult BM supports enhanced regeneration of LSCs, which is consistent with the clinical observations of higher incidence of AML and poorer prognosis in adult patients compared to leukemia in childhood (boxed arrows indicate enhanced, dashed arrows suppressed engraftments).

Similar articles

Cited by

References

    1. Mendelson A, Frenette PS. Hematopoietic stem cell niche maintenance during homeostasis and regeneration. Nat Med. 2014;20:833–846. doi: 10.1038/nm.3647. - DOI - PMC - PubMed
    1. Morrison SJ, Scadden DT. The bone marrow niche for haematopoietic stem cells. Nature. 2014;505:327–334. doi: 10.1038/nature12984. - DOI - PMC - PubMed
    1. Essers MA, et al. IFNalpha activates dormant haematopoietic stem cells in vivo. Nature. 2009;458:904–908. doi: 10.1038/nature07815. - DOI - PubMed
    1. Trumpp A, Essers M, Wilson A. Awakening dormant haematopoietic stem cells. Nat Rev Immunol. 2010;10:201–209. doi: 10.1038/nri2726. - DOI - PubMed
    1. Wilson A, et al. Hematopoietic stem cells reversibly switch from dormancy to self-renewal during homeostasis and repair. Cell. 2008;135:1118–1129. doi: 10.1016/j.cell.2008.10.048. - DOI - PubMed

Publication types

MeSH terms

Substances