

Molecular Complexity Calculated by Fractal Dimension
- PMID: 30700728
- PMCID: PMC6353876
- DOI: 10.1038/s41598-018-37253-8
Molecular Complexity Calculated by Fractal Dimension
Abstract
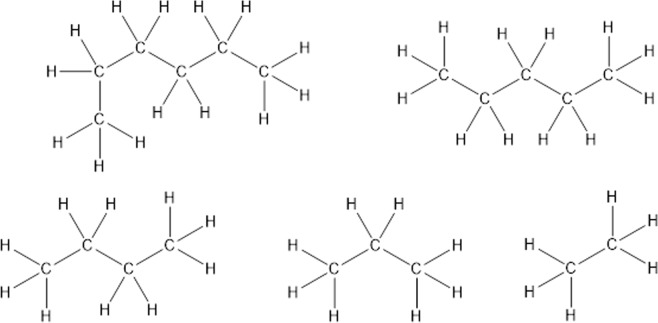
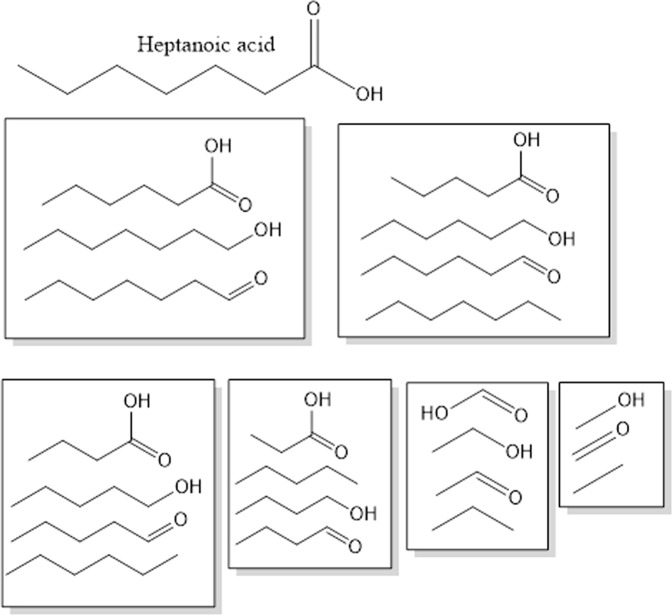
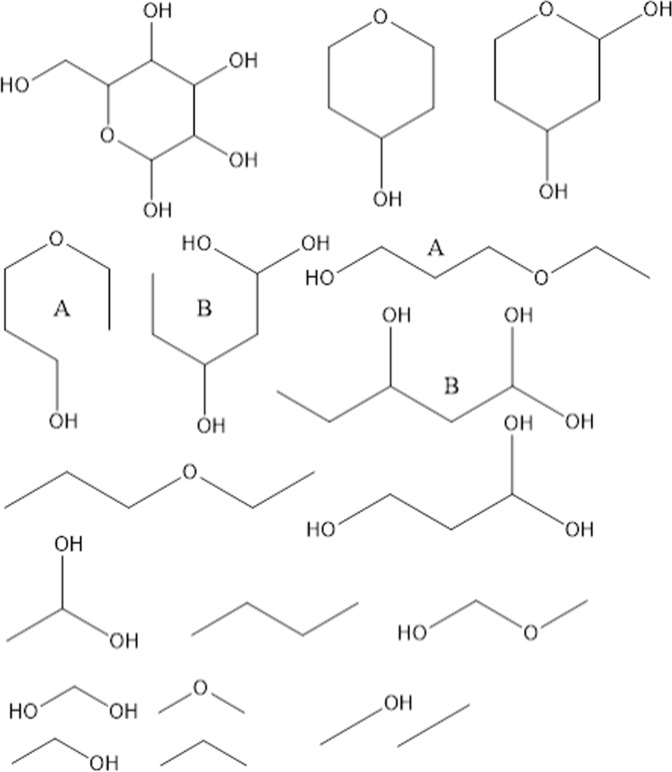
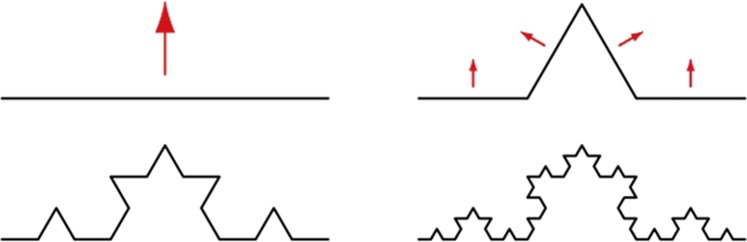
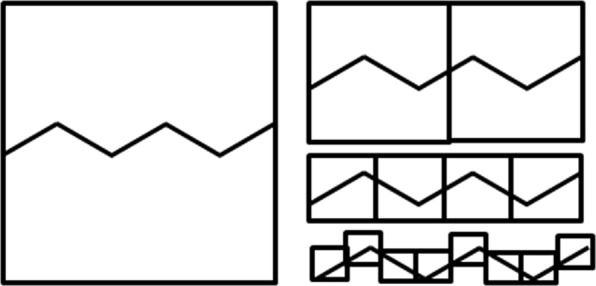
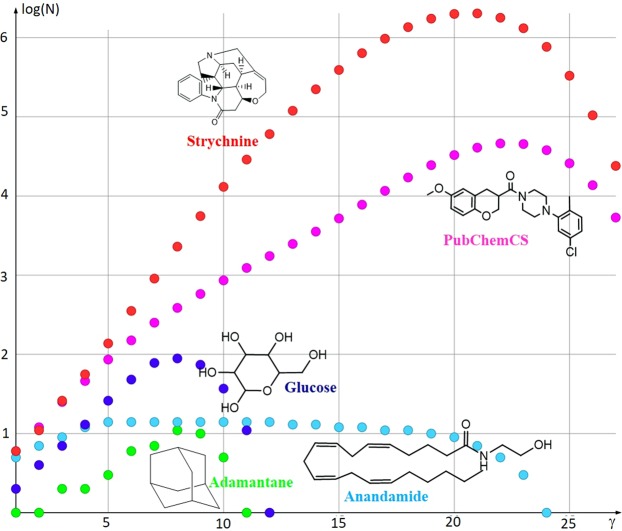
Molecular complexity is an important characteristic of organic molecules for drug discovery. How to calculate molecular complexity has been discussed in the scientific literature for decades. It was known from early on that the numbers of substructures that can be cut out of a molecular graph are of importance for this task. However, it was never realized that the cut-out substructures show self-similarity to the parent structures. A successive removal of one bond and one atom returns a series of fragments with decreasing size. Such a series shows self-similarity similar to fractal objects. Here we used the number of distinct fragments to calculate the fractal dimension of the molecule. The fractal dimension of a molecule is a new matter constant that incorporates all features that are currently known to be important for describing molecular complexity. Furthermore, this is the first work that reveals the fractal nature of organic molecules.
Conflict of interest statement
The authors declare no competing interests.
Figures
References
-
- Rashevsky NL. information theory, and topology. Bulletin of mathematical biology. 1955;17:229–235.
-
- Shannon CE, Weaver W, Burks AW. The mathematical theory of communication. The Bell System Technical Journal. 1948;27(379–423):623–656. doi: 10.1002/j.1538-7305.1948.tb00917.x. - DOI
LinkOut - more resources
Full Text Sources
Other Literature Sources
