

Global and regional trends of atmospheric sulfur
- PMID: 30700755
- PMCID: PMC6353995
- DOI: 10.1038/s41598-018-37304-0
Global and regional trends of atmospheric sulfur
Erratum in
-
Author Correction: Global and regional trends of atmospheric sulfur.Sci Rep. 2020 Mar 24;10(1):5675. doi: 10.1038/s41598-020-62441-w. Sci Rep. 2020. PMID: 32205844 Free PMC article.
Abstract
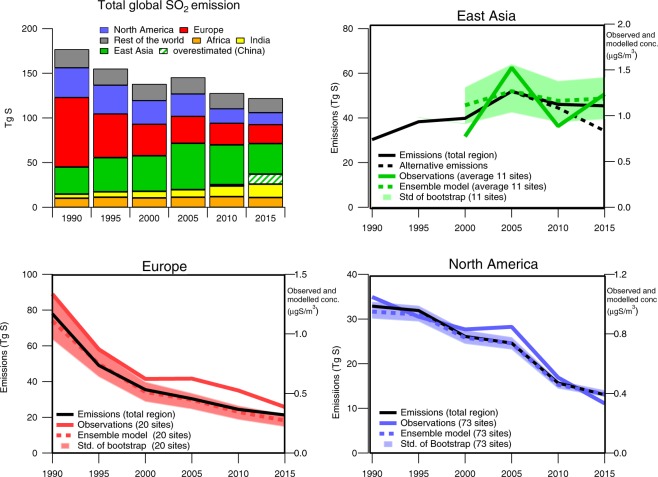
The profound changes in global SO2 emissions over the last decades have affected atmospheric composition on a regional and global scale with large impact on air quality, atmospheric deposition and the radiative forcing of sulfate aerosols. Reproduction of historical atmospheric pollution levels based on global aerosol models and emission changes is crucial to prove that such models are able to predict future scenarios. Here, we analyze consistency of trends in observations of sulfur components in air and precipitation from major regional networks and estimates from six different global aerosol models from 1990 until 2015. There are large interregional differences in the sulfur trends consistently captured by the models and observations, especially for North America and Europe. Europe had the largest reductions in sulfur emissions in the first part of the period while the highest reduction came later in North America and East Asia. The uncertainties in both the emissions and the representativity of the observations are larger in Asia. However, emissions from East Asia clearly increased from 2000 to 2005 followed by a decrease, while in India a steady increase over the whole period has been observed and modelled. The agreement between a bottom-up approach, which uses emissions and process-based chemical transport models, with independent observations gives an improved confidence in the understanding of the atmospheric sulfur budget.
Conflict of interest statement
The authors declare no competing interests.
Figures

References
-
- Hoesly RM, et al. Historical (1750–2014) anthropogenic emissions of reactive gases and aerosols from the Community Emissions Data System (CEDS) Geosci. Model Dev. 2018;11:369–408. doi: 10.5194/gmd-11-369-2018. - DOI
-
- Maas, R. & Grennfelt, P. E. (Eds.) Towards Cleaner Air. Scientific Assessment Report 2016, EMEP Steering Body and Working Group on Effects of the Convention on Long-Range Transboundary Air Pollution, https://www.unece.org/fileadmin/DAM/env/lrtap/ExecutiveBody/35th_session... (Oslo, 2016).
-
- UNECE. Towards Cleaner Air. Scientific Assessment Report 2016: North America. https://www.unece.org/fileadmin/DAM/env/documents/2016/AIR/Publications/... (Geneva, 2016).
-
- Vestreng V, Myhre G, Fagerli H, Reis S, Tarrasón L. Twenty-five years of continuous sulphur dioxide emission reduction in Europe. Atmos. Chem. Phys. 2007;7:3663–3681. doi: 10.5194/acp-7-3663-2007. - DOI
Publication types
LinkOut - more resources
Full Text Sources
