. 2019 Jan 30;9(1):976.
doi: 10.1038/s41598-018-37086-5.

Flax latitudinal adaptation at LuTFL1 altered architecture and promoted fiber production

Affiliations

Flax latitudinal adaptation at LuTFL1 altered architecture and promoted fiber production

Rafal M Gutaker et al. Sci Rep. .

Abstract

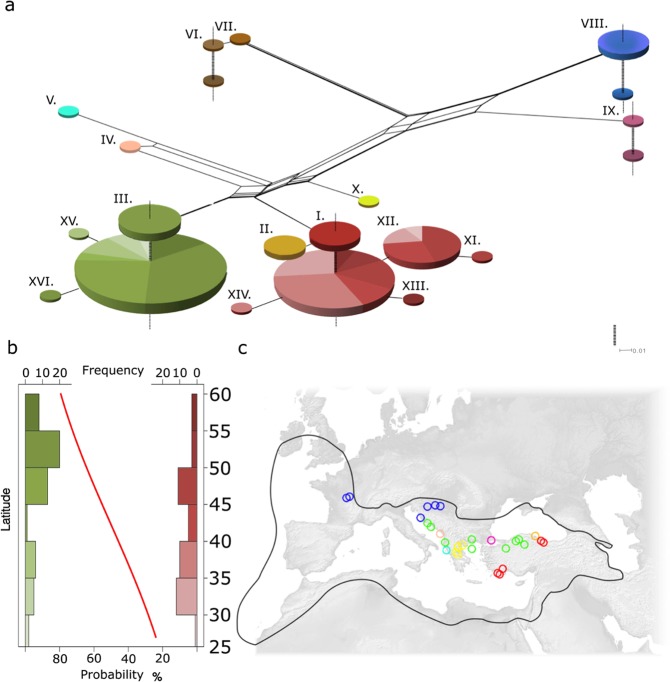
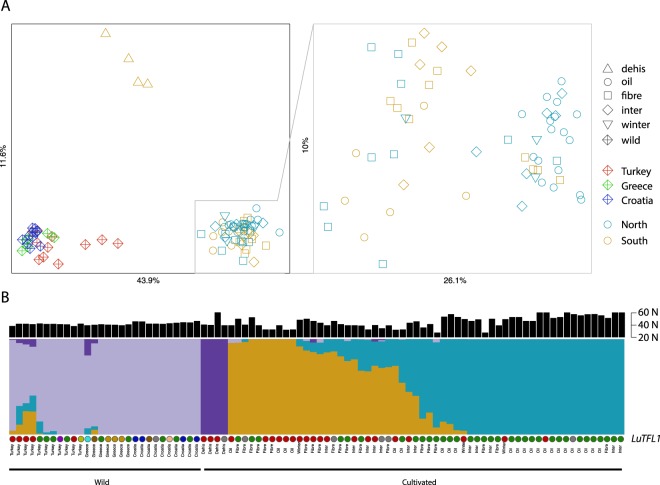
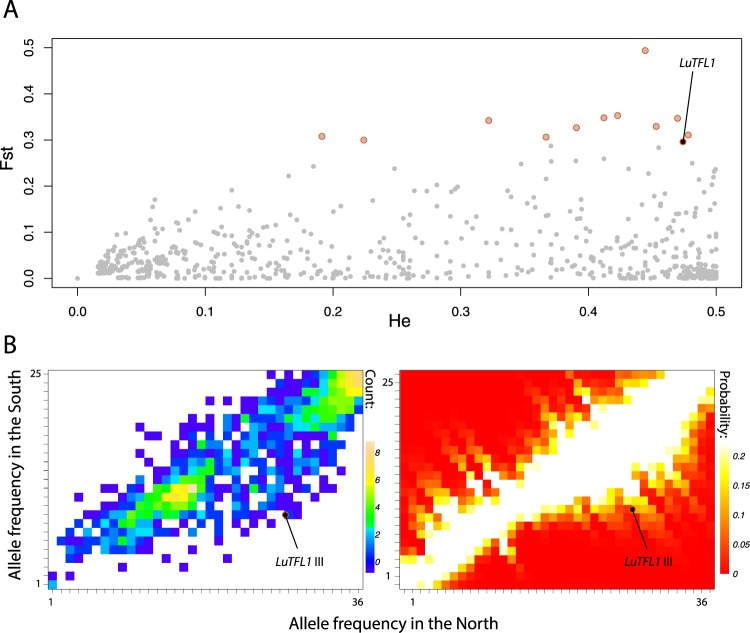
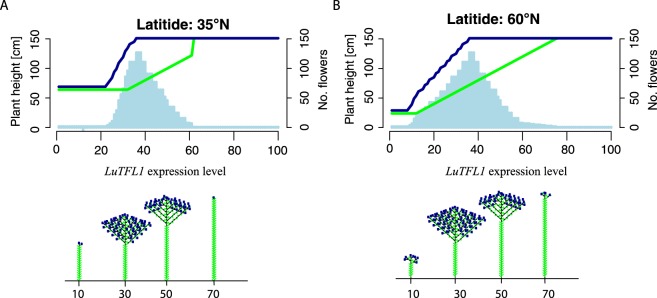
After domestication in the Near East around 10,000 years ago several founder crops, flax included, spread to European latitudes. On reaching northerly latitudes the architecture of domesticated flax became more suitable to fiber production over oil, with longer stems, smaller seeds and fewer axillary branches. Latitudinal adaptations in crops typically result in changes in flowering time, often involving the PEBP family of genes that also have the potential to influence plant architecture. Two PEBP family genes in the flax genome, LuTFL1 and LuTFL2, vary in wild and cultivated flax over latitudinal range with cultivated flax receiving LuTFL1 alleles from northerly wild flax populations. Compared to a background of population structure of flaxes over latitude, the LuTFL1 alleles display a level of differentiation that is consistent with selection for an allele III in the north. We demonstrate through heterologous expression in Arabidopsis thaliana that LuTFL1 is a functional homolog of TFL1 in A. thaliana capable of changing both flowering time and plant architecture. We conclude that specialized fiber flax types could have formed as a consequence of a natural adaptation of cultivated flax to higher latitudes.


Conflict of interest statement

The authors declare no competing interests.

Figures

Figure 1
Figure 1
Haplotype network of LuTFL1 locus in cultivated and pale flax: (a) Splits Tree network of pale (top) and cultivated (bottom) flax, size of nodes is proportional to number of samples with the same haplotype, continuous branches denote molecular distance between haplotypes, vertical dotted lines link different species within same haplotype. (b) Histogram showing latitudinal gradient of LuTFL1 alleles in cultivated flax, in green, frequency of northern haplotype cluster (LuTFL1.III), in red, frequency of southern haplotype cluster (LuTFL1.I) with fitted logistic regression curve (p-value of 0.00144) reflecting occurrence probability of northern haplotype in latitude gradient. (c) Map of Europe marked with wild distribution of pale flax (black line) and pale flax sampling locations (colours correspond to haplotypes in splits network).
Figure 2
Figure 2
Population structure of pale flax and varieties of cultivated flax based on RADseq data: (A) Multidimensional Scaling Plot of pairwise nucleotide distances between flax accessions separates three main flax populations. (B) Admixture plot of flax four ancestral components. Pale flax samples are arranged from east (Eastern Anatolia) to northwest (Central Europe), while samples of cultivated flax were arranged based on admixture proportions. Above presented is the latitude at which the individual plant was sampled. Below, individuals are annotated with allele of LuTFL1 they carry; colours are the same as in Fig. 1.
Figure 3
Figure 3
Outliers to neutral allele frequencies between northern and southern cultivated flax populations: (A) FST values for RAD neutral SNPs plotted as a function of heterozygosity. Outliers with elevated FST and heterozygosity are marked with red circles. Outlier SNPs distinguishing alleles I and III in LuTFL1 locus are marked with black. (B) Two dimensional allele frequency spectrum of RAD loci alleles between northern and southern cultivated flaxes. Frequency of LuTFL1.III SNPs are marked as circles. To the right: probability heat maps of sampling frequency combinations given the allele frequency spectrum based on distance from the diagonal.
Figure 4
Figure 4
Strength of selection on LuTFL1 III in modern and historic flaxes. Estimates of selection coefficient over latitude and time, where latitude correlates to time of arrival of agriculture.
Figure 5
Figure 5
Flax LuTFL1 gene complements TFL1 mutant in Arabidopsis thaliana: (A) Images of plants in 2x magnification at the median time to first open flower in tfl1–2 mutant (20 days). Both Ler-0 wild type and tfl1–2 mutant complemented with 35 S::LuTFL1 are not yet flowering at that time. (B) Plants at their median time to end of flowering in respective cohorts. Mutant tfl1–2 ended flowering after 23 days and reached average height of 69 mm; by contrast Ler-0 wild type and 35 S::LuTFL1 plants flowered until 36th and 40th day reaching 134 and 211 mm height respectively.
Figure 6
Figure 6
Plots summarizing parameters of flax inflorescence simulated with pgrowth model over different base levels of TFL1 expression. Shown below charts are representative flax architectures associated with base levels of TFL1. (A) Chart and architecture diagrams for plants grown at N 60° latitude with assumed floral initiation threshold set to 14 hours. (B) Chart and architecture diagrams for plants grown at N 35° latitude with assumed flowering threshold set to 14 hours.

References

    1. Purugganan MD, Fuller DQ. The nature of selection during plant domestication. Nature. 2009;457:843–848. doi: 10.1038/nature07895. - DOI - PubMed
    1. Zohary, D., Hopf, M. & Weiss, E. Domestication of Plants in the Old World: The Origin and Spread of Domesticated Plants in South-West Asia, Europe, and the Mediterranean Basin, 4th Edition (2012).
    1. Colledge, S., Conolly, J. & Shennan, S. The Evolution of Neolithic Farming from SW Asian Origins to NW European Limits. European Journal of Archaeology 10.1177/1461957105066937 (2016).
    1. Shennan S, et al. Regional population collapse followed initial agriculture booms in mid-Holocene Europe. Nat. Commun. 2013;4:2486. doi: 10.1038/ncomms3486. - DOI - PMC - PubMed
    1. Timpson A, et al. Reconstructing regional population fluctuations in the European Neolithic using radiocarbon dates: a new case-study using an improved method. J. Archaeol. Sci. 2014;52:549–557. doi: 10.1016/j.jas.2014.08.011. - DOI

Publication types