. 2019 Jan 30;9(1):963.
doi: 10.1038/s41598-018-37764-4.

Ecosystem metabolism drives pH variability and modulates long-term ocean acidification in the Northeast Pacific coastal ocean

Affiliations

Ecosystem metabolism drives pH variability and modulates long-term ocean acidification in the Northeast Pacific coastal ocean

Alexander T Lowe et al. Sci Rep. .

Abstract

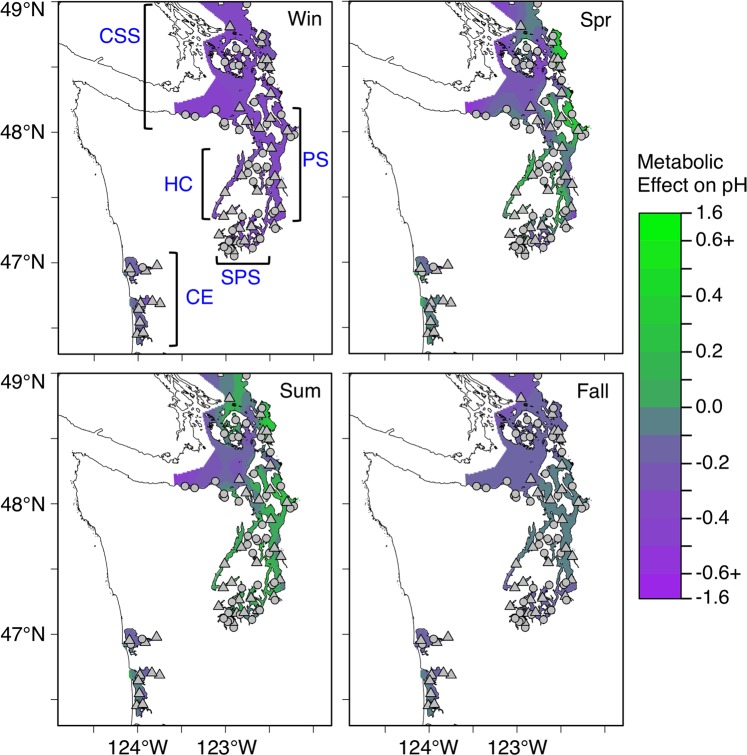
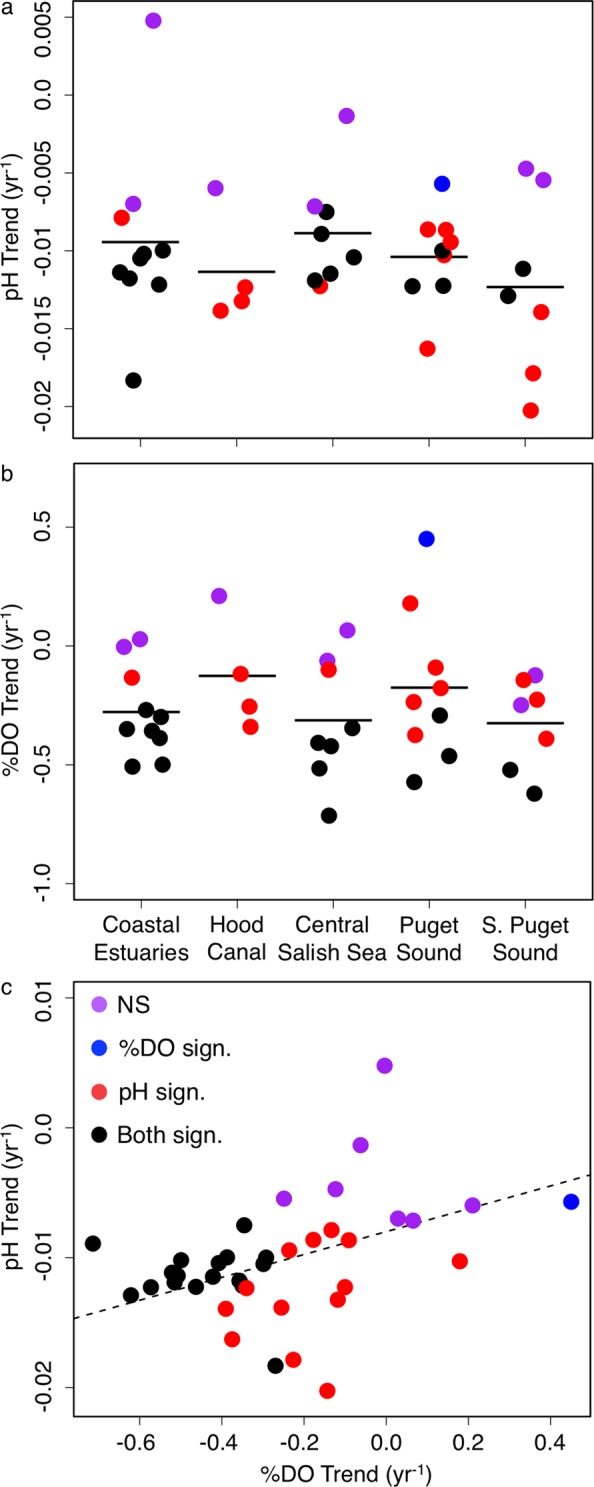
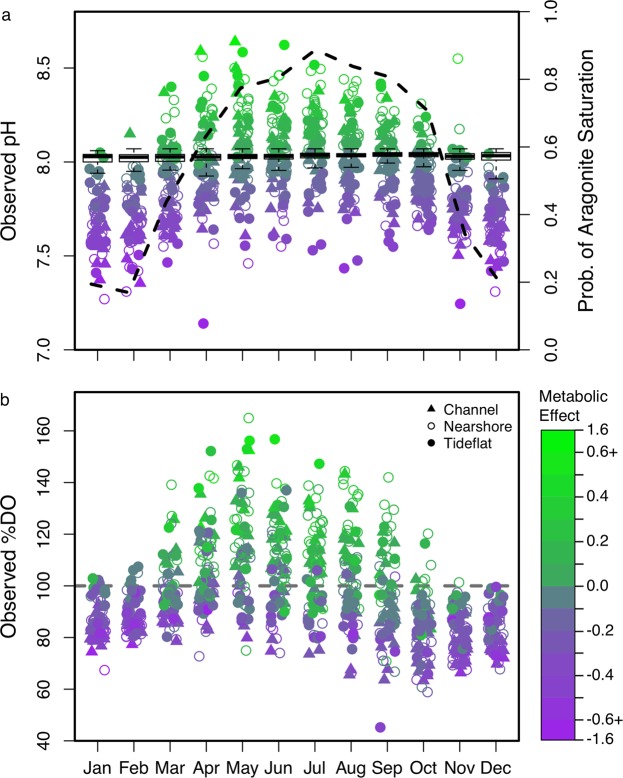
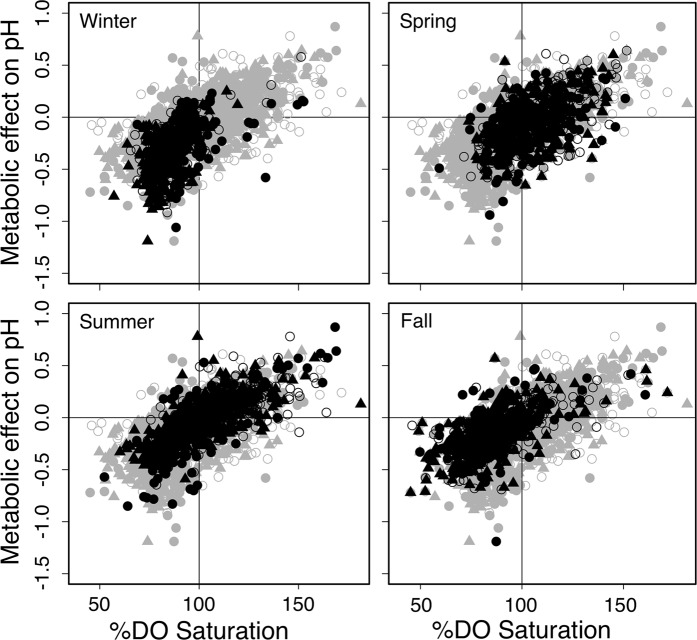
Ocean acidification poses serious threats to coastal ecosystem services, yet few empirical studies have investigated how local ecological processes may modulate global changes of pH from rising atmospheric CO2. We quantified patterns of pH variability as a function of atmospheric CO2 and local physical and biological processes at 83 sites over 25 years in the Salish Sea and two NE Pacific estuaries. Mean seawater pH decreased significantly at -0.009 ± 0.0005 pH yr-1 (0.22 pH over 25 years), with spatially variable rates ranging up to 10 times greater than atmospheric CO2-driven ocean acidification. Dissolved oxygen saturation (%DO) decreased by -0.24 ± 0.036% yr-1, with site-specific trends similar to pH. Mean pH shifted from <7.6 in winter to >8.0 in summer concomitant to the seasonal shift from heterotrophy (%DO < 100) to autotrophy (%DO > 100) and dramatic shifts in aragonite saturation state critical to shell-forming organisms (probability of undersaturation was >80% in winter, but <20% in summer). %DO overwhelmed the influence of atmospheric CO2, temperature and salinity on pH across scales. Collectively, these observations provide evidence that local ecosystem processes modulate ocean acidification, and support the adoption of an ecosystem perspective to ocean acidification and multiple stressors in productive aquatic habitats.


Conflict of interest statement

The authors declare no competing interests.

Figures

Figure 1
Figure 1
Seasonal mean metabolic effect on pH (observed pH minus predicted ‘atmospheric equilibrium’ pH) in Washington state waters, USA. Sampling location identified by dots (rotating) and triangles (core). Subregions defined in the analysis are coastal estuaries (CE), Hood Canal (HC), South Puget Sound (SPS), Puget Sound (PS) and Central Salish Sea (CSS).
Figure 2
Figure 2
Calculated pH (a) and %DO (b) change per year for each subregion (horizontal bars) and individual core sites (points) from 1991–2015. Subregions for a and b shown below Fig. 2b. Site-specific trend of pH vs. trend of %DO (c). Dashed line is the slope of regression fit to all pH vs. %DO observations. Color of point indicates significance of trend: NS = neither pH or %DO trend over time were significantly different than zero at that site, DO Sign. = only %DO trend significant, pH Sign. = only pH trend significant, Both Sign. = both trends significant. Number of observations varies by site.
Figure 3
Figure 3
Seasonal variation of observed pH and %DO. (a) Mean monthly site-specific pH (points), distribution of predicted ‘atmospheric equilibrium’ pH across all sites for each month (boxplots), and the probability of observing aragonite supersaturation within the entire sampling region in a given month (dashed line corresponding to right axis). (b) Mean monthly site-specific dissolved oxygen saturation. Color of points in a and b corresponds to the magnitude of the metabolic effect on pH (observed pH minus ‘atmospheric equilibrium’ pH) as indicated in the legend (same as Fig. 1). Shape of points indicates habitat of the site: triangle = channel, open circle = nearshore, filled circle = tideflat.
Figure 4
Figure 4
Relationship of mean seasonal metabolic effect on pH vs. %DO saturation. Crossbars indicate ‘atmospheric equilibrium’ pH and 100% DO saturation. Black points represent the seasonal site-specific mean pH across all years of sampling. Light gray points show all values. Shape of points indicate habitat: triangle = channel, open circle = nearshore, filled circle = tideflat.

Similar articles

Cited by

References

    1. Aufdenkampe AK, et al. Riverine coupling of biogeochemical cycles between land, oceans, and atmosphere. Front. Ecol. Environ. 2011;9:53–60. doi: 10.1890/100014. - DOI
    1. Cloern JE. Our evolving conceptual model of the coastal eutrophication problem. Mar. Ecol. Prog. Ser. 2001;210:223–253. doi: 10.3354/meps210223. - DOI
    1. Orth RJ, et al. A global crisis for seagrass ecosystems. BioScience. 2006;56:987–996. doi: 10.1641/0006-3568(2006)56[987:AGCFSE]2.0.CO;2. - DOI
    1. Zu Ermgassen PSE, et al. Historical ecology with real numbers: past and present extent and biomass of an imperilled estuarine habitat. Proc. Biol. Sci. 2012;279:3393–3400. doi: 10.1098/rspb.2012.0313. - DOI - PMC - PubMed
    1. Boyd P, Hutchins D. Understanding the responses of ocean biota to a complex matrix of cumulative anthropogenic change. Mar. Ecol. Prog. Ser. 2012;470:125–135. doi: 10.3354/meps10121. - DOI