. 2019 Jan 30;9(1):942.
doi: 10.1038/s41598-018-37806-x.

Creation of haemoglobin A1c direct oxidase from fructosyl peptide oxidase by combined structure-based site specific mutagenesis and random mutagenesis

Affiliations

Creation of haemoglobin A1c direct oxidase from fructosyl peptide oxidase by combined structure-based site specific mutagenesis and random mutagenesis

Noriyuki Ogawa et al. Sci Rep. .

Abstract

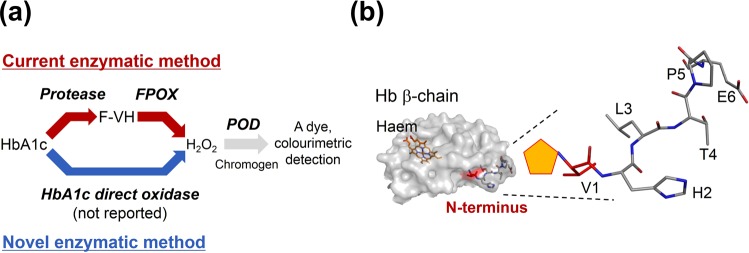
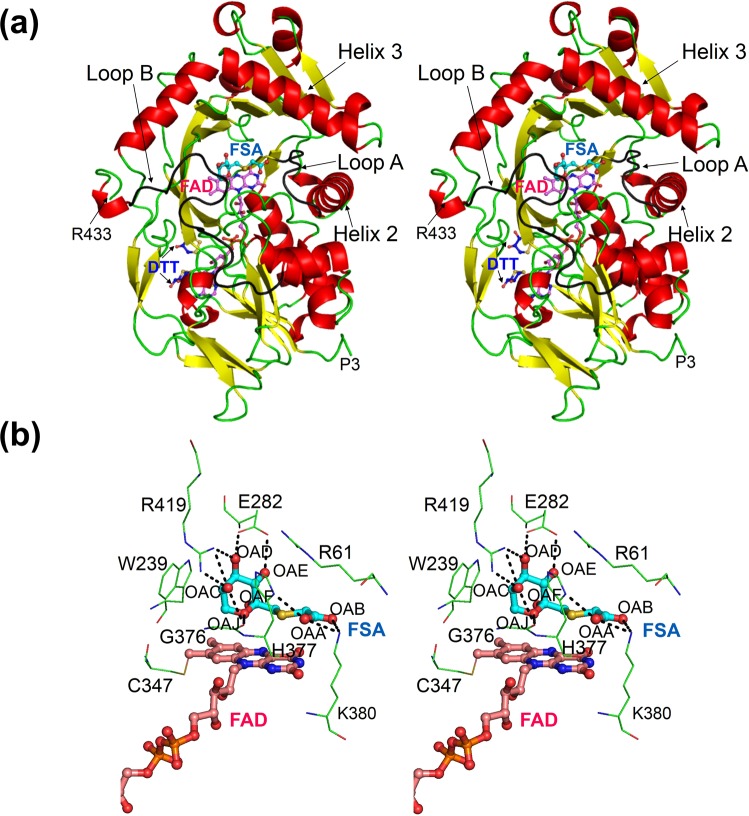
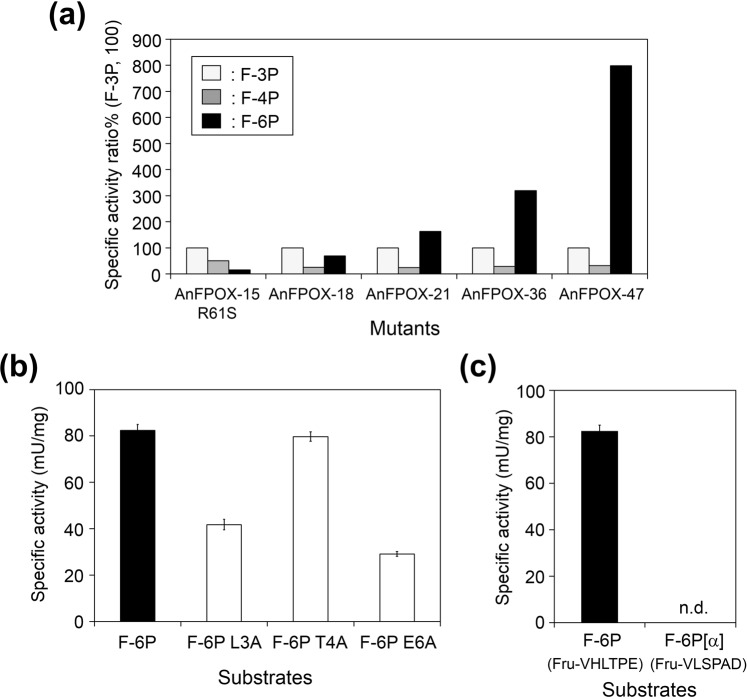
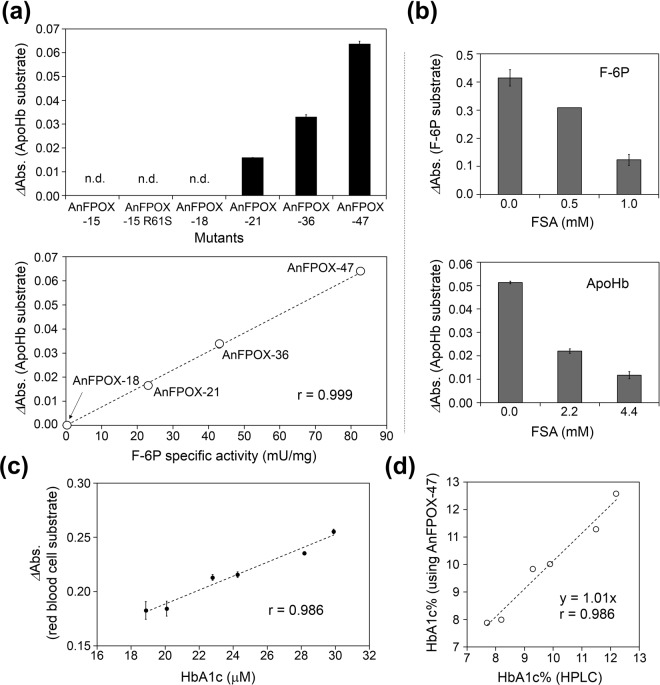
The currently available haemoglobin A1c (HbA1c) enzymatic assay consists of two specific steps: proteolysis of HbA1c and oxidation of the liberated fructosyl peptide by fructosyl peptide oxidase (FPOX). To develop a more convenient and high throughput assay, we devised novel protease-free assay system employing modified FPOX with HbA1c oxidation activity, namely HbA1c direct oxidase (HbA1cOX). AnFPOX-15, a modified FPOX from Aspergillus nidulans, was selected for conversion to HbA1cOX. As deduced from the crystal structure of AnFPOX-15, R61 was expected to obstruct the entrance of bulky substrates. An R61G mutant was thus constructed to open the gate at the active site. The prepared mutant exhibited significant reactivity for fructosyl hexapeptide (F-6P, N-terminal amino acids of HbA1c), and its crystal structure revealed a wider gate observed for AnFPOX-15. To improve the reactivity for F-6P, several mutagenesis approaches were performed. The ultimately generated AnFPOX-47 exhibited the highest F-6P reactivity and possessed HbA1c oxidation activity. HbA1c levels in blood samples as measured using the direct assay system using AnFPOX-47 were highly correlated with the levels measured using the conventional HPLC method. In this study, FPOX was successfully converted to HbA1cOX, which could represent a novel in vitro diagnostic modality for diabetes mellitus.


Conflict of interest statement

The authors declare no competing interests.

Figures

Figure 1
Figure 1
The scheme of the HbA1c enzymatic assay and N-terminal six amino acids of the haemoglobin (Hb) β-chain and its glycation site. (a) Reaction scheme of the HbA1c enzymatic method. A red arrow indicates the current enzymatic method consists of specific two tandem enzymatic reaction, namely, proteolysis of HbA1c and the subsequent oxidation of the liberated fructosyl valyl histidine (F-VH) by fructosyl peptide oxidase (FPOX). Afterwards, according to the general detection method, the generated hydrogen peroxide (H2O2) is then reacted with a chromogen in the presence of peroxidase to produce a dye. The concentration of F-VH can be quantitatively determined by measuring the specific absorption of the dye. The amount of F-VH reflects that of HbA1c stoichiometrically. A blue arrow indicates the novel enzymatic method employing HbA1c direct oxidase (HbA1cOX) to form H2O2. H2O2 can be converted to a signal in the same manner as the current method. (b) Left, Hb β-chain structure (PDB id: 2ND2) is shown as a surface model, and the haem prosthetic group is shown as an orange stick model. The N-terminal valine, the glycation site of HbA1c, is coloured red. The N-terminal six amino acids are shown as a line model and superimposed on the surface model of Hb β-chain. Right, magnified structure of the N-terminal six amino acids of the Hb β-chain. The orange pentagon at an amino group of the N-terminal valine denotes the fructosyl moiety, suggesting a plausible F-6P structure.
Figure 2
Figure 2
Crystal structure of AnFPOX-15. (a) The overall structure of FPOX-15/FSA. Colours denote the secondary structure elements (red: α-helices; yellow: β-strands; green; loops and coils). Loop A and B are shown in gray. FAD, FSA, sulphate ion and oxidised DTT are shown as ball and stick model in cyan, purple and blue respectively. The figures were prepared using cross-eyed stereo diagram. (b) The substrate-binding site of FPOX-15/FSA. FSA and the surrounding amino acid residues are shown at cross-eyed stereo diagram. Dashed lines indicate hydrogen bonds between FSA and FPOX-15. Oxygen atoms of FSA molecule are labeled with OAA-OAJ. FAD is also shown partially.
Figure 3
Figure 3
The structure of the active site gates of AnFPOX-15 and AnFPOX-15 R61G and the mutation effect of the R61 residue for F-6P reactivity. (a) Coordination of amino acids around the active site of AnFPOX-15. AnFPOX-15/FSA (upper) and AnFPOX-15 R61G/FSA (lower) are shown. The molecule in the right panel is rotated 70° from that in the left panel. R61 residue of AnFPOX-15 and G61 residue of AnFPOX-15 R61G are coloured red. (b) Focused molecular surface view of the active site gates of AnFPOX-15/FSA and AnFPOX-15 R61G/FSA. Each 61 residue is shown in red. Coordinated FSA and FAD are shown as stick models in cyan and magenta, respectively. (c) Change in F-6P oxidation specific activity by replacing R61 of AnFPOX-15. n.d.: not detected.
Figure 4
Figure 4
Substrate specificity of the generated AnFPOX mutants. (a) Specific activity ratio% of AnFPOX mutants for fructosyl tripeptide (F-3P), fructosyl tetrapeptide (F-4P) and F-6P, each specific activity for F-3P was regarded as 100%. (b) Specific activity of AnFPOX-47 for F-6P and its analogues. Data are mean ± SD (n = 3). F-6P analogues share the common amino acid sequence excluding the replacement of one amino acid with alanine. (c) Comparison of specific activity for F-6P and F-6P[α]. Data are mean ± SD (n = 3). F-6P[α] is a fructosyl hexapeptide of the glycated Hb α-chain, featuring the amino acid sequence of VLSPAD with glycation at an amino group of the N-terminal valine. F-6P[α] is an interfering substance in the HbA1c measurement. n.d.: not detected.
Figure 5
Figure 5
Structural change by mutations introduced into AnFPOX. (a) Upper: Structural difference of loop A of AnFPOX-15/FSA and AnFPOX-21/FSA shown as a cartoon model with side-chain as a stick model. Lower: each loop A is shown as setting by B-factor putty on PyMOL programme. Warm colour shows high B-factor, and the reduced B-factor following in the order of red, orange, yellow, sky blue then blue. (b) Structural difference of 71 residue in helix 2 was compared between AnFPOX-15/FSA and AnFPOX-21/FSA. Y71 residue was replaced with serine in AnFPOX-21. (c) Structural difference of 75 residue in helix 2 was shown as a cartoon model to compare 75 residue between AnFPOX-15/FSA and AnFPOX-21/FSA. L75 residue was replaced with phenylalanine in AnFPOX-21. (d) The upper panel shows structural difference of helix 3 between AnFPOX-15/FSA and AnFPOX-21/FSA. Each structure is shown as a cartoon model. The side-chain of the featuring residues is shown as a stick model. Magenta indicates innate basic residues on AnFPOX-15, blue indicates acidic residues and red indicates basic residues newly introduced in the generation of AnFPOX-21. Lower panel, the left figure shows the active site of AnFPOX-21/FSA. Dotted arrows show the distance from the sulphur atom of FSA to the α-carbon of each K108 and R115. Right figure shows rough structural model of F-6P. An orange pentagon indicates a fructosyl moiety. The distances were measured using the crystal structure of the haemoglobin β-chain (PDB id: 2DN2) using the PyMOL programme. The distance of approx. 16 Å is a length from nitrogen of N-terminal valine to α-carbon of P5, and distance of approx. 3.8 Å is a length from α-carbon of P5 to that of E6. The side-chain length of R115 is approximately 7 Å, and that of E6 of F-6P is approximately 4.7 Å. When F-6P is coordinated onto FAD of AnFPOX-21, E6 of F-6P is located around the active site gate, enabling the formation of electrostatic interactions between them. (e) The active site gates of AnFPOX-15/FSA and AnFPOX-21/FSA are shown in surface model. Coordinated FSA and FAD are shown as cyan and magenta, respectively.
Figure 6
Figure 6
Evaluation of the HbA1c direct oxidation activity of the generated mutants. (a) Upper panel, the detection of ApoHb oxidation activity using each of the generated AnFPOX mutants (final concentration of 230 μg/mL) and ApoHb (final concentration of 1.36 mg/mL, including 7.1% HbA1c). A signal was calculated from the change in absorbance during incubation at 37 °C for 1 h by subtracting absorbance change in reagent without enzymes. Data are presented as the mean ± SD (n = 3). n.d.: not detected. Lower panel, correlation between the reaction signal intensity using ApoHb (final concentration of 1.36 mg/mL, including 7.1% HbA1c) as a substrate and the F-6P specific activity (mU/mg) of each of the mutants. Data are the mean of triplicate measurement. (b) Inhibitor (FSA) susceptibility assay of AnFPOX-47 using F-6P (final concentration of 0.1 mM) and ApoHb (final concentration of 1.36 mg/mL, including 7.1% HbA1c). AnFPOX-47 was used at final concentrations of 2.3 and 217 μg/mL for F-6P and ApoHb, respectively. FSA was added and mixed prior to substrate addition. Data are presented as the mean ± SD (n = 3). (c) Correlation between the signals (ΔAbs) obtained via the reaction of AnFPOX-47 with concentration of HbA1c included in Hb samples. Data are presented as the mean ± SD (n = 4). The concentrations of HbA1c was calculated from HbA1c% determined by HPLC and the total Hb concentration determined using Hb-SLS method. AnFPOX-47 (final concentration of 2.6 mg/mL) was subjected to reaction. The signal (ΔAbs.) was calculated from the change in absorbance during incubation for 1 h at 37 °C. (d) Correlation between the HPLC method and our developed assay system using AnFPOX-47. HbA1c% was calculated from the average of measured value obtained with AnFPOX-47 based on a calibration curve prepared with two independently measured Hb samples (HbA1c%: 6.7 and 12.3).

Similar articles

Cited by

References

    1. Cho SJ, Roman G, Yeboah F, Konishi Y. The road to advanced glycation end products: a mechanistic perspective. Current medicinal chemistry. 2007;14:1653–1671. doi: 10.2174/092986707780830989. - DOI - PubMed
    1. Bunn HF, Gabbay KH, Gallop PM. The glycosylation of hemoglobin: relevance to diabetes mellitus. Science (New York, N.Y.) 1978;200:21–27. doi: 10.1126/science.635569. - DOI - PubMed
    1. Jeppsson JO, et al. Approved IFCC reference method for the measurement of HbA1c in human blood. Clinical chemistry and laboratory medicine. 2002;40:78–89. doi: 10.1515/cclm.2002.016. - DOI - PubMed
    1. Hamwi A, Schweiger CR, Veitl M, Schmid R. Quantitative measurement of HbA1c by an immunoturbidimetric assay compared to a standard HPLC method. American journal of clinical pathology. 1995;104:89–95. doi: 10.1093/ajcp/104.1.89. - DOI - PubMed
    1. Sakurabayashi I, et al. New enzymatic assay for glycohemoglobin. Clinical chemistry. 2003;49:269–274. doi: 10.1373/49.2.269. - DOI - PubMed

MeSH terms