. 2019 Feb;16(2):191-198.
doi: 10.1038/s41592-018-0304-8. Epub 2019 Jan 28.

T cell antigen discovery via signaling and antigen-presenting bifunctional receptors

Affiliations

T cell antigen discovery via signaling and antigen-presenting bifunctional receptors

Alok V Joglekar et al. Nat Methods. 2019 Feb.

Abstract

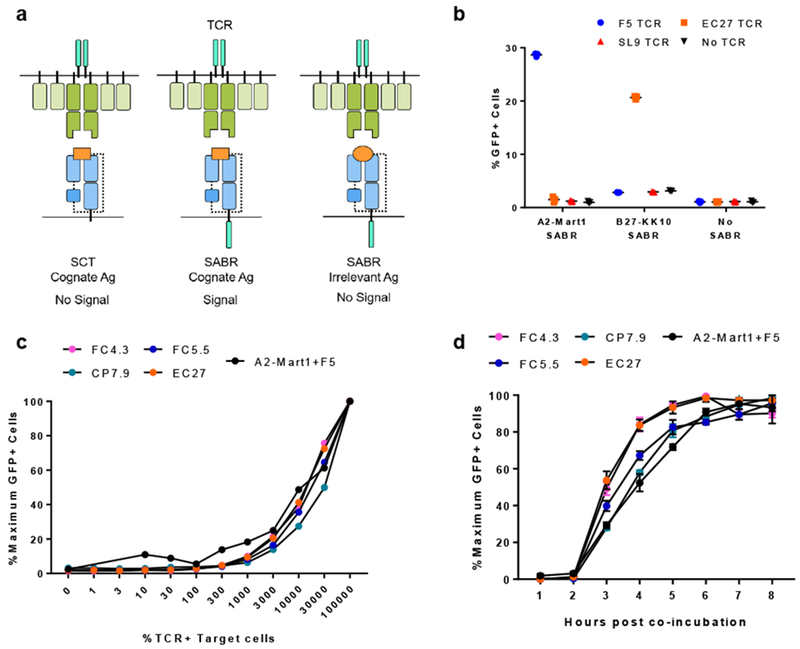
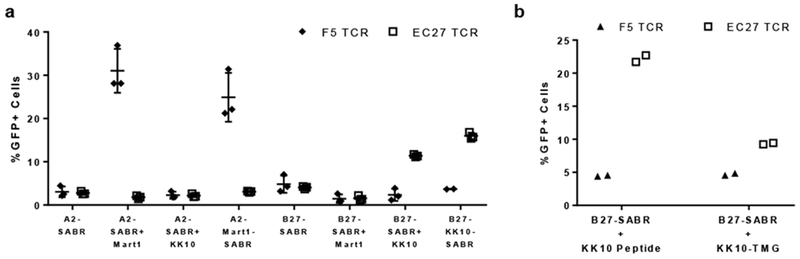
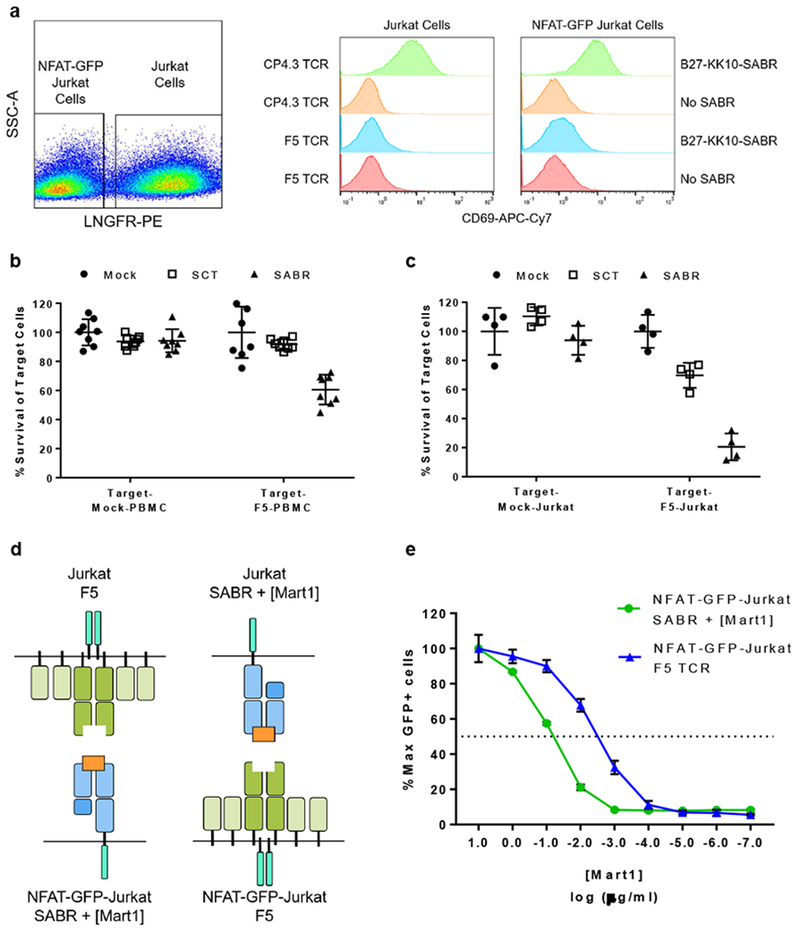
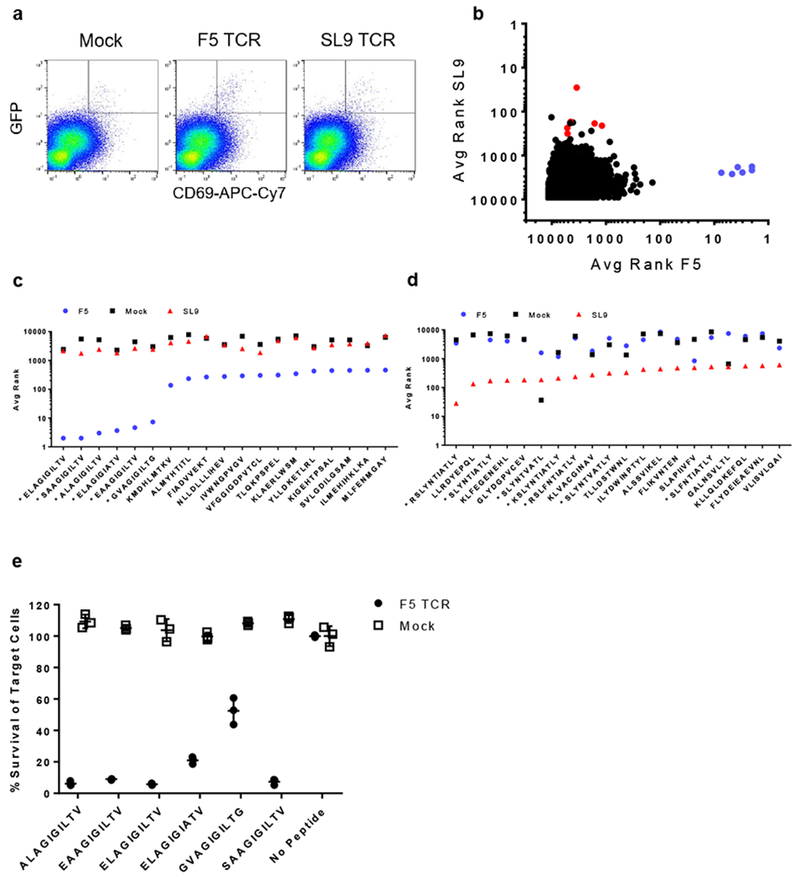
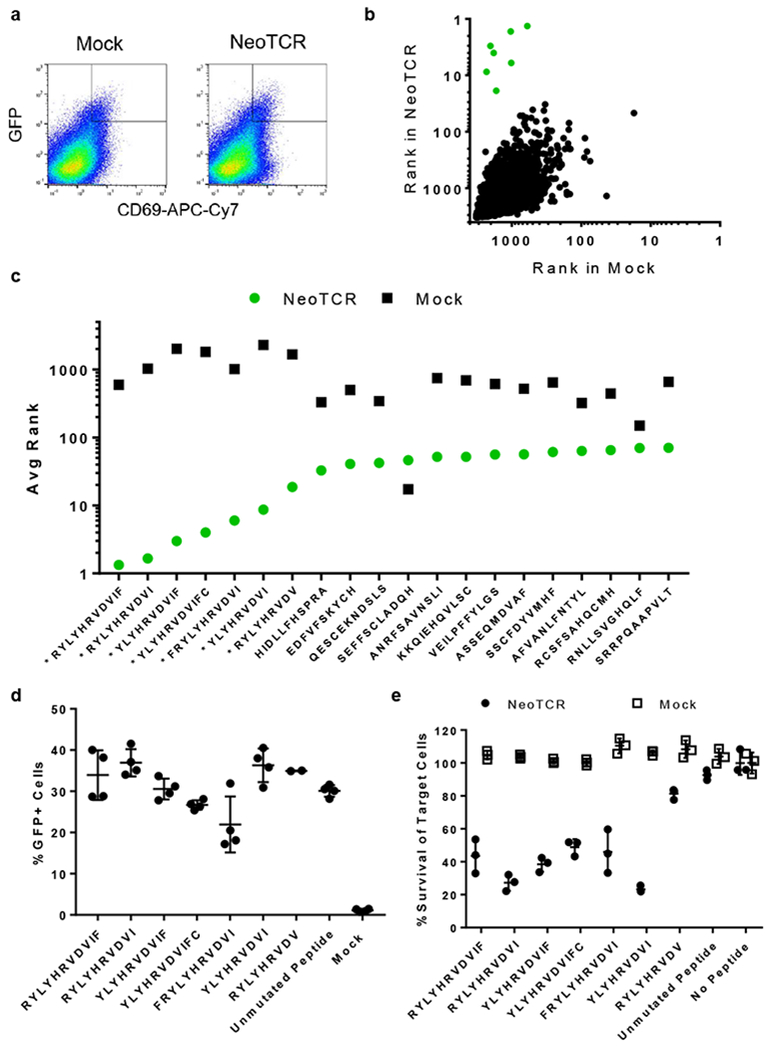
CD8+ T cells recognize and eliminate tumors in an antigen-specific manner. Despite progress in characterizing the antitumor T cell repertoire and function, the identification of target antigens remains a challenge. Here we describe the use of chimeric receptors called signaling and antigen-presenting bifunctional receptors (SABRs) in a cell-based platform for T cell receptor (TCR) antigen discovery. SABRs present an extracellular complex comprising a peptide and major histocompatibility complex (MHC), and induce intracellular signaling via a TCR-like signal after binding with a cognate TCR. We devised a strategy for antigen discovery using SABR libraries to screen thousands of antigenic epitopes. We validated this platform by identifying the targets recognized by public TCRs of known specificities. Moreover, we extended this approach for personalized neoantigen discovery.


Conflict of interest statement

Competing Financial Interests Statements:

A.V.J., M.T.L., M.T.B., and D.B. are co-inventors on a patent application concerning the described technology. D.B. is a consultant of PACT and head of their scientific advising board. J.R.H. and A.R. are directors and consultants of PACT; M.T.B. and S.P are employees of PACT; J.M.Z. is a consultant of PACT; and each of the foregoing individuals have equity interests in PACT. The other authors declare that no competing interests exist.

Figures

Fig 1.
Fig 1.. Signaling and antigen-presenting bifunctional receptors.
a. Schematics demonstrating SABRs and TCR-pMHC specific signaling. SCT – Single Chain Trimer, Ag - Antigen. Dotted lines indicate Gly-Ser linkers. b. GFP expression by SABR transduced NFAT-GFP-Jurkat cells upon co-culture with TCR-transduced Jurkat cells. Line and error bars indicate mean±sd, n=3 biologically independent cell culture replicates. c. Titration of SABR signal by measuring frequency of GFP+ cells in co-culture assays at 8 hours after co-culture. For FC4.3, FC5.5, CP7.9, and EC27 TCRs, NFAT-GFP-Jurkat cells transduced with B27-KK10-SABR were used. Dots indicate values from n=1 experiment. d. Timecourse of GFP expression by SABR transduced NFAT-GFP-Jurkat cells co-cultured with TCR-transduced Jurkat cells. For FC4.3, FC5.5, CP7.9, and EC27 TCRs, NFAT-GFP-Jurkat cells transduced with B27-KK10-SABR were used. Line and error bars indicate mean±sd, n=3 biologically independent cell culture replicates, n=4 for A2-Mart1.
Fig 2.
Fig 2.. Different modes of antigen presentation by SABRs.
a. GFP expression by NFAT-GFP-Jurkats transduced with empty SABRs pulsed with soluble MART1 or KK10 peptides and co-cultured with Jurkat cells transduced with F5 or EC27 TCRs. Line and error bars indicate mean±sd, n=3 biologically independent cell culture replicates. b. GFP expression by NFAT-GFP-Jurkats co-transduced with empty B27-SABRs KK10-TMG or transduced with empty B27-SABR and pulsed with KK10 peptide, and co-cultured with Jurkat cells transduced with F5 or EC27 TCRs. Dots indicate individual values from n=2 biologically independent cell culture replicates.
Fig 3.
Fig 3.. SABRs induce a bona fide TCR signal.
a. Induction of CD69 expression in co-culture assays with indicated TCR-SABR combinations is shown. The panel on the left is a representative plot showing discrimination of NFAT-GFP-Jurkat cells and Jurkat cells based on LNGFR expression. The panel on the right shows histogram for CD69 expression in the indicated populations. The shown data are representative of n=2 biologically independent cell culture replicates. b. Cytotoxicity induced by SABR-expressing primary T cells against Jurkat cells. Line and error bars indicate mean±sd for n=8 biologically independent cell culture replicates. c. Cytotoxicity induced by SABR-expressing primary T cells against autologous target cells. Line and error bars indicate mean±sd for n=4 biologically independent cell culture replicates. d. Schematic of the assay to measure antigen sensitivity of A2-SABR (left) and of F5-TCR (right). e. Antigen sensitivity of SABR and TCR signaling indicating GFP signal as a function of MART1 peptide. Dots and error bars indicate mean±sd for n=3 biologically independent cell culture replicates. The dotted horizontal line indicates half-maximal signal.
Fig 4.
Fig 4.. Proof-of-concept of using SABR libraries for TCR antigen discovery.
a. Sorting A2-SABR library cells based on GFP and CD69 expression in co-culture assays. Representative flow cytometry plots from one out of three biologically independent cell culture replicates are shown. The rectangle in the top right corner of each flow plot shows the gate used for the sort. Frequency of cells in the sort gate is indicated as percentage. b. Average ranks from F5 and SL9 sorts. Each dot represents the average rank for a unique epitope. Purple dots indicate EAAGIGILTV analogs and red dots indicate SLYNTVATL analogs. c. Average ranks for the top 20 hits from the F5 sort. Epitopes with asterisks indicate EAAGIGILTV analogs. d. Average ranks for the top 20 hits from the SL9 sort. Epitopes with asterisks indicate SLYNTVATL analogs. e. Validation of the top hits in the F5 sort by cytotoxicity assays performed on K562 cells expressing HLA-A2.1 and pulsed with the indicated peptides. Line and error bars indicate means±s.d. for n=3 biologically independent cell culture replicates.
Fig 5.
Fig 5.. Personalized neoantigen discovery using SABR libraries.
a. Sorting NeoAg-SABR library cells based on GFP and CD69 expression in co-culture assays. Representative flow cytometry plots from one out of three biologically independent cell culture replicates are shown. The rectangle in the top right corner of each flow plot shows the gate used for the sort. Frequency of cells in the sort gate is indicated as percentage. b. Average ranks from neoTCR and mock sorts. Each dot represents the average rank for a unique epitope. Green dots indicate USP7-derived epitopes. c. Average ranks for the top 20 hits from the neoTCR sort. Epitopes with asterisks indicate USP7-derived epitopes. d. Validation of top hits identified in the NeoAg-SABR screen by measuring GFP expression in co-culture assays. Line and error bars represent mean±sd, n=4 biologically independent cell culture replicates, n=2 for RYLYHRVDV. e. Validation of the top hits in the Neo TCR sort by cytotoxicity assays performed on K562 cells expressing HLA-A2.1 and pulsed with the indicated peptides. Line and error bars indicate means±s.d. for n=3 biologically independent cell culture replicates.

References

    1. Shankaran V et al. IFNgamma and lymphocytes prevent primary tumour development and shape tumour immunogenicity. Nature 410, 1107–1111, doi:10.1038/35074122 (2001). - DOI - PubMed
    1. Lollini PL, Cavallo F, Nanni P & Forni G Vaccines for tumour prevention. Nature reviews. Cancer 6, 204–216, doi:10.1038/nrc1815 (2006). - DOI - PubMed
    1. Leach DR, Krummel MF & Allison JP Enhancement of antitumor immunity by CTLA-4 blockade. Science 271, 1734–1736 (1996). - PubMed
    1. Dong H et al. Tumor-associated B7-H1 promotes T-cell apoptosis: a potential mechanism of immune evasion. Nature medicine 8, 793–800, doi:10.1038/nm730 (2002). - DOI - PubMed
    1. Yee C et al. Adoptive T cell therapy using antigen-specific CD8+ T cell clones for the treatment of patients with metastatic melanoma: in vivo persistence, migration, and antitumor effect of transferred T cells. Proceedings of the National Academy of Sciences of the United States of America 99, 16168–16173, doi:10.1073/pnas.242600099 (2002). - DOI - PMC - PubMed

Publication types

MeSH terms