. 2019 Feb;566(7744):344-349.
doi: 10.1038/s41586-019-0896-x. Epub 2019 Jan 30.

PU.1 controls fibroblast polarization and tissue fibrosis

Affiliations

PU.1 controls fibroblast polarization and tissue fibrosis

Thomas Wohlfahrt et al. Nature. 2019 Feb.

Abstract

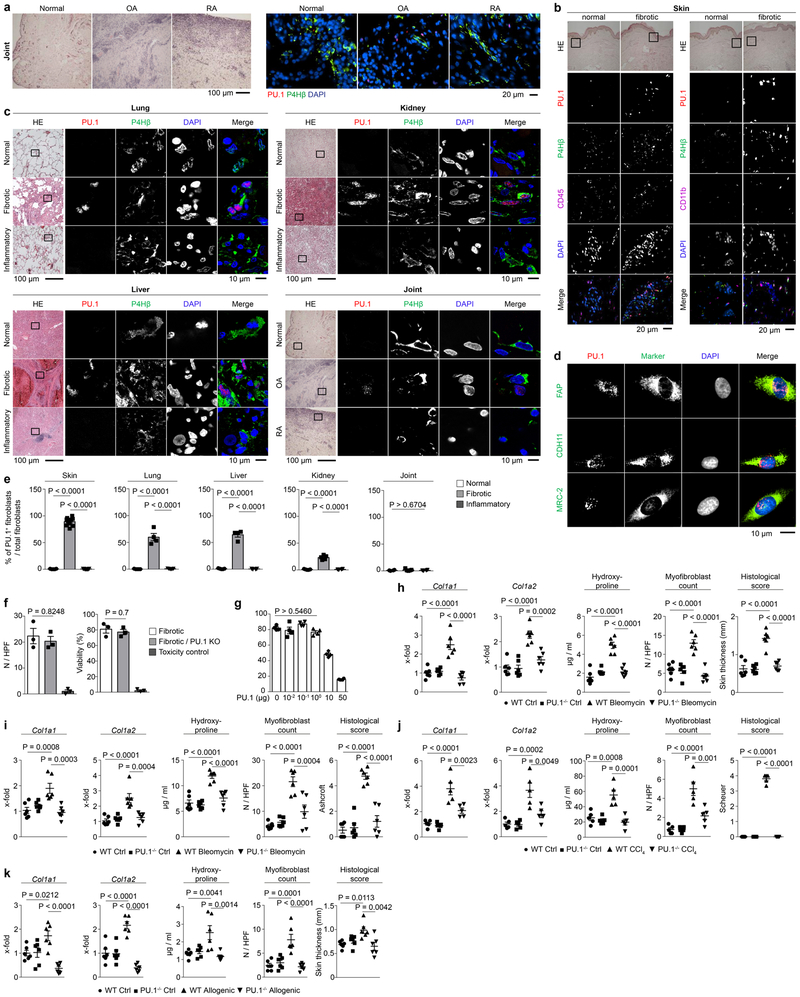
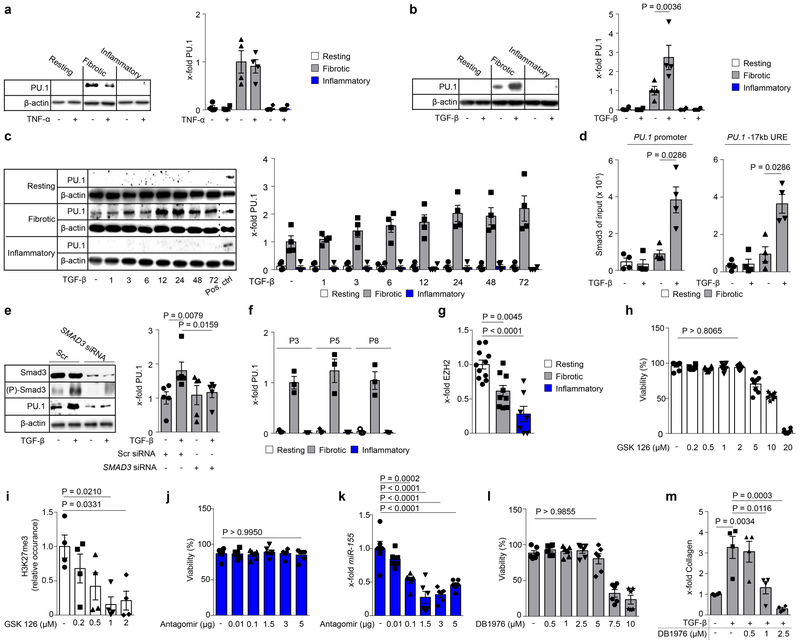
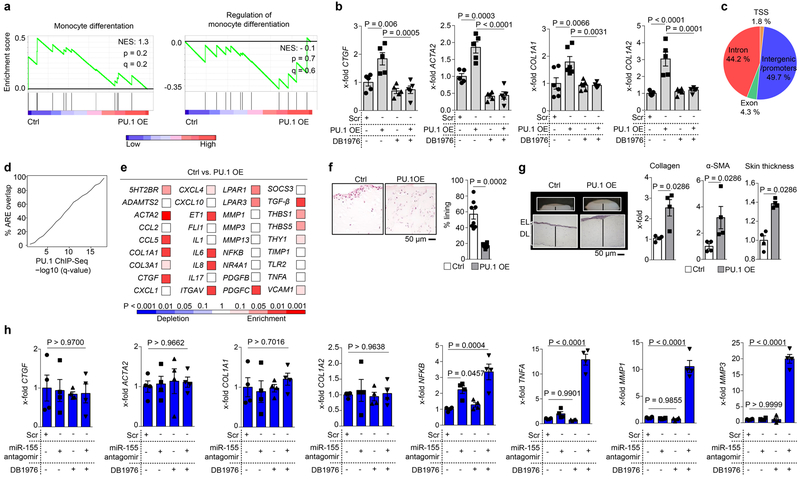
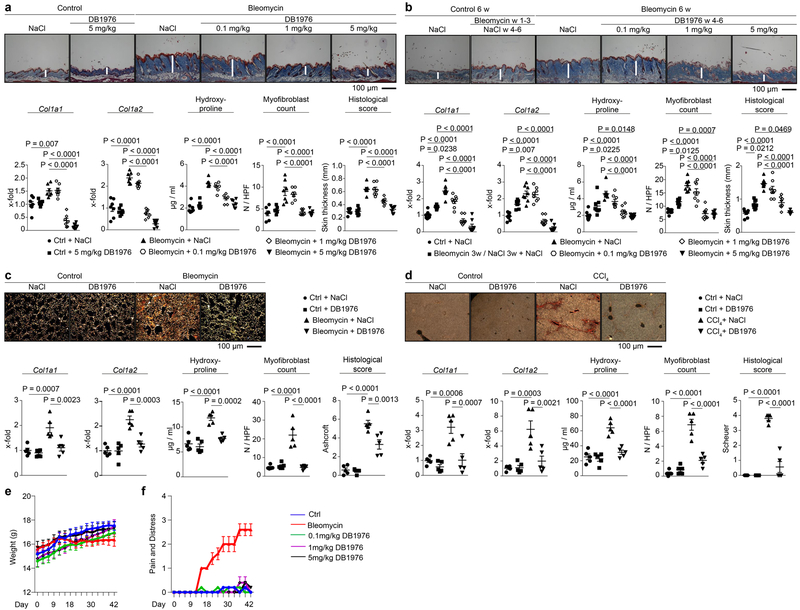
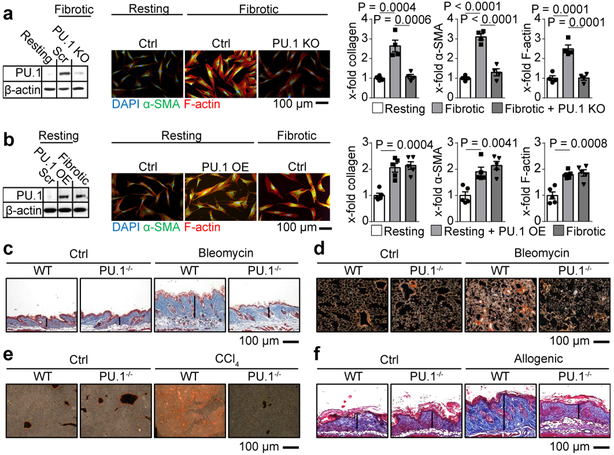
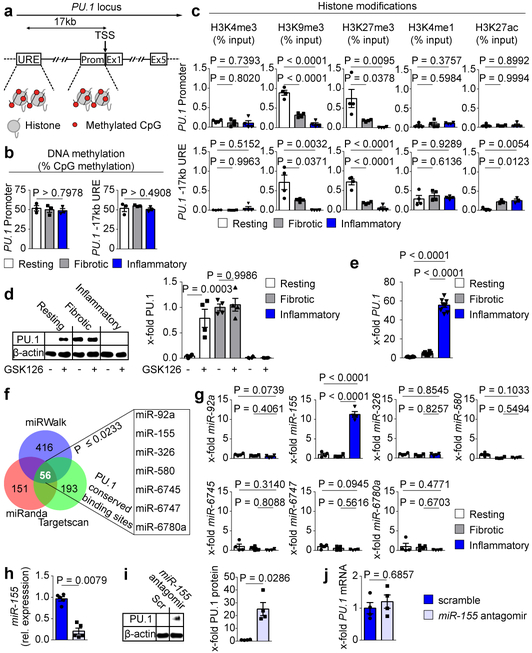
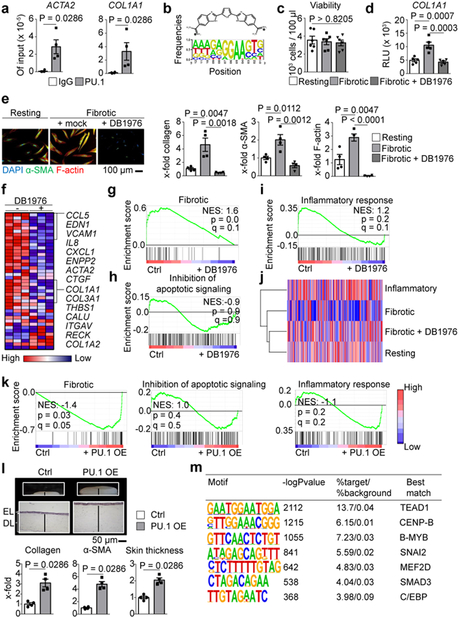
Fibroblasts are polymorphic cells with pleiotropic roles in organ morphogenesis, tissue homeostasis and immune responses. In fibrotic diseases, fibroblasts synthesize abundant amounts of extracellular matrix, which induces scarring and organ failure. By contrast, a hallmark feature of fibroblasts in arthritis is degradation of the extracellular matrix because of the release of metalloproteinases and degrading enzymes, and subsequent tissue destruction. The mechanisms that drive these functionally opposing pro-fibrotic and pro-inflammatory phenotypes of fibroblasts remain unknown. Here we identify the transcription factor PU.1 as an essential regulator of the pro-fibrotic gene expression program. The interplay between transcriptional and post-transcriptional mechanisms that normally control the expression of PU.1 expression is perturbed in various fibrotic diseases, resulting in the upregulation of PU.1, induction of fibrosis-associated gene sets and a phenotypic switch in extracellular matrix-producing pro-fibrotic fibroblasts. By contrast, pharmacological and genetic inactivation of PU.1 disrupts the fibrotic network and enables reprogramming of fibrotic fibroblasts into resting fibroblasts, leading to regression of fibrosis in several organs.


Conflict of interest statement

Conflict of Interest

None

Figures

Extended Data Figure 1:
Extended Data Figure 1:. PU.1-expressing fibroblasts control tissue fibrosis.
Representative images of (a, b) immunofluorescence (IF) and (c) confocal microscopy of human skin, lung, liver, kidney and joint biopsy specimens stained for PU.1 (red), prolyl 4-hydroxylase (P4H)β (green), CD45 or CD11b (cyan), and DAPI (blue); respective tissues were obtained from healthy individuals (n = 5 each), idiopathic pulmonary fibrosis (IPF; n = 4), acute asthma (n = 5), alcoholic liver cirrhosis (n = 4), autoimmune hepatitis (n = 4), cirrhotic kidney (n = 4), interstitial nephritis (n = 5), osteoarthritis (OA; n = 5) and rheumatoid arthritis (RA; n = 5). Hematoxylin & eosin (HE) stained tissue specimens are included. (d) Representative IF images (n = 4) of explanted fibrotic fibroblasts stained for PU.1 (red) and one of the following markers (green): fibroblast activation protein (FAP), cadherin 11 (CDH11) or MRC-2; nuclei were stained with DAPI (blue). (e) Semi-quantification of PU.1+ fibroblasts / total P4Hβ+ fibroblasts per high-power field (HPF); respective tissues were obtained from healthy individuals (n = 5 each), patients with systemic sclerosis (n = 10), plaque psoriasis (n = 7), idiopathic pulmonary fibrosis (IPF; n = 4), acute asthma (n = 5), alcoholic liver cirrhosis (n = 4), autoimmune hepatitis (n = 4), cirrhotic kidney (n = 4) and interstitial nephritis (n = 5), osteoarthritis (OA; n = 5) and rheumatoid arthritis (RA; n = 5). (f) Cell counts and viability of CRISPR-Cas9 mediated PU.1 knockout in human fibrotic fibroblasts compared to unaffected control fibroblasts and fibroblasts treated with 50% DMSO as toxic control (n = 3 each). Cells were counted per HPF. (g) Resting fibroblasts co-transfected with different amounts of PU.1 plasmid as indicated (n = 4 each); cell viability of fibroblasts was determined by CCK-8 toxicity assay. (h-k) Relative Col1a1, Col1a2 mRNA levels, hydroxyproline concentration, myofibroblast counts / HPF and respective histological scores (skin thickness, Ashcroft, Scheuer) of (h) bleomycin-induced skin (n = 6 per group), (i) bleomycin-induced lung fibrosis (n = 6 per group), (j) carbon tetrachloride (CCl4)-induced liver fibrosis model (n = 5 per group) and (k) sclerodermatous chronic graft-versus-host disease (scl cGvHD) model (n = 6 per group); data are shown as the mean ± s.e.m. of respective n independent experiments. Respective P values were determined by one-way ANOVA with Tukey's multiple comparison post hoc test.
Extended Data Figure 2:
Extended Data Figure 2:. PU.1-expressing fibroblasts in different mouse models of fibrosis.
Representative hematoxylin & eosin (HE) and immunofluorescence (IF) stainings of (a) bleomycin-induced skin fibrosis model (n = 8 per group); injections of the solvent, sodium chloride (NaCl), served as controls. (b) Mouse model of sclerodermatous chronic graft versus host disease (scl cGvHD; n = 8 per group); syngeneic transplanted mice were used as controls. (c) Fibrosis model of tight skin 1 (Tsk-1) mice (n = 11 per group); (d) model of bleomycin-induced pulmonary fibrosis (n = 6 per group); controls received intratracheal application of NaCl. Representative HE and IF images of respective tissues stained for PU.1 (red), vimentin (green), DAPI (blue) are included. Total Pu.1 mRNA in the respective tissues was measured by qPCR. Absolute counts of PU.1-expressing fibroblasts were analyzed per high power field (HPF). (e, f) Mouse model of bleomycin-induced skin fibrosis (n = 5 per group); controls received NaCl. Representative HE and IF images of frozen serial tissue sections; boxed areas in the HE stained sections indicate the representative histological regions (yellow, orange, purple) of the correspondingly framed IF panels; (e) control littermates or PU.1GFP reporter mice stained for DAPI (blue) and the respective antibody as indicated in the figure (red); (f) IgG control of NaCl treated control littermates of PU.1GFP reporter mice (n = 3 per group) (g) Semi-quantitative analysis of PU.1 (GFP)-expressing fibroblasts. Absolute counts of PU.1-expressing fibroblasts were analyzed per HPF (respective n is given in e). Control images of GFP+ tissue sections are presented in Extended Data Fig. 10d. Data are shown as the mean ± s.e.m. of respective n independent experiments. P values were determined by either one-way ANOVA with Tukey's multiple comparison post hoc test or two-tailed Mann–Whitney U test if two groups were compared.
Extended Data Figure 3:
Extended Data Figure 3:. PU.1-expressing fibroblasts in bleomycin-induced lung and CCl4-induced liver fibrosis.
(a-e) Mouse model of bleomycin-induced lung fibrosis (n = 4 per group); controls received sodium chloride (NaCl). (a, b) Representative hematoxylin & eosin (HE) and immunofluorescence (IF) images of (a) frozen serial tissue sections of control littermates or PU.1GFP reporter mice stained for DAPI (blue) and the respective antibody as indicated in the figure (red); (a, b, f, g) boxed areas in the HE stained sections indicate the representative histological regions of the corresponding IF panels; experiments were repeated three-times independently with similar results; (b) IgG control of NaCl treated control littermates of PU.1GFP reporter mice (n = 3 per group). (c) Semi-quantitative analysis of PU.1 (GFP)-expressing fibroblasts (n = 4 each). Absolute counts of PU.1-expressing fibroblasts were analyzed per high-power field (HPF). Control images of GFP+ tissue sections are presented in Extended Data Fig. 10e. (d, e) Flow cytometric analysis of digested lungs; (d) respective gating strategy to characterize GFP+ cells; (e) quantitative analysis of PU.1 (GFP)-expressing fibroblasts (n = 3 each). Percentage of CD45vimentin+ PU.1-expressing fibroblasts per lung sample. (f-j) Mouse model of CCl4-induced liver fibrosis (n = 4); controls received oil. (f, g) Representative HE and IF images of frozen serial tissue sections of (f) control littermates or PU.1GFP reporter mice stained for DAPI (blue) and the respective antibody as indicated in the figure (red); (g) IgG control of sunflower oil treated control littermates of PU.1GFP reporter mice (n = 4 per group). (h) Semi-quantitative analysis of PU.1 (GFP)-expressing fibroblasts (n = 3 each). Absolute counts of PU.1-expressing fibroblasts were analyzed per HPF. Control images of GFP+ tissue sections are presented in Extended Data Fig. 10f. (i, j) Flow cytometric analysis of digested livers; (i) respective gating strategy to characterize GFP+ cells; (j) quantitative analysis of PU.1 (GFP)-expressing fibroblasts (n = 4 each). Percentage of CD31CD45vimentin+ PU.1-expressing fibroblasts per liver sample; data are shown as the mean ± s.e.m. of respective n biologically independent samples. P values were determined by one-way ANOVA with Tukey's multiple comparison post hoc test.
Extended Data Figure 4:
Extended Data Figure 4:. Regulation of PU.1 expression in fibroblasts.
(a-c) PU.1 expression levels of primary human fibroblasts. Representative Western Blot and semi-quantitative analysis of PU.1 protein expression in resting (isolated from normal skin), fibrotic (isolated from fibrotic skin of SSc patients) and inflammatory (isolated from inflamed joints of RA patients) fibroblasts stimulated (a) with/without TNF-α for 24 hours, (b) with/without TGF-β for 24 hours or (c) for up to 72 hours (n = 4 each). Protein extracts of fibrotic fibroblasts were used as positive control in each lane. (d) ChIP analysis (n = 4 each) assessing binding of Smad3 to PU.1 promoter and its −17 kb upstream regulatory element (URE) is shown. (e) siRNA mediated knockdown of SMAD3 in fibrotic fibroblasts stimulated with/without TGF-β for 24 hours (n = 5). Scrambled (scr) siRNA was used as control. (f) Expression levels of PU.1 protein in primary human resting, fibrotic and inflammatory fibroblasts (n = 3 each) cultured ex vivo for several passages. (g) Expression levels of the enhancer of zeste homolog 2 (EZH2) in resting (n = 11), fibrotic (n = 9) and inflammatory fibroblasts (n = 7) relative to β-actin as assessed by Western blot analysis; results are presented relative to resting fibroblasts. (h, i) Resting fibroblasts treated with different concentrations of GSK126 as indicated (n = 3 each); (h) cell viability of fibroblasts was determined by CCK-8 toxicity assay. (i) Expression levels of H3K27me3 relative to total H3 as assessed by Western blot analysis; results are presented relative to untreated control. (j, k) Inflammatory fibroblasts treated with different concentrations of miR-155 antagomirs as indicated (n = 3 each) to investigate (j) cell viability by CCK-8 toxicity assay; (k) miR-155 expression levels relative to let-7b as assessed by qPCR; results are presented relative to cells co-transfected with scrambled antagomirs. (l, m) Fibrotic fibroblasts treated with different concentrations of DB1976 to analyze (l) cell viability by CCK-8 toxicity assay (n = 6); (m) DB1976 dose dependent effects upon TGF-β-induced collagen production (n = 4 each); results are presented relative to untreated control. Data are shown as the mean ± s.e.m. of respective n independent experiments. P values were determined by one-way ANOVA with Tukey's multiple comparison post hoc test.
Extended Data Figure 5:
Extended Data Figure 5:. Profibrotic potential of PU.1.
(a) Gene set enrichment analysis (GSEA) of quantitative RNA-Seq signals of Gene Ontology (GO)-defined monocytic related gene clusters in human resting fibroblasts co-transfected with PU.1 (n = 4). Resting fibroblasts co-transfected with control plasmid served as controls (n = 4). NES, normalized enrichment score; (b) mRNA expression levels of indicated transcripts in human resting fibroblasts treated with or without DB1976 and simultaneously co-transfected with or without PU.1 (pUNO.1-hSPI1, called ‘PU.1 OE’ here, n = 5 each) as assessed by qPCR; co-transfection with scrambled (scr) plasmid served as control. Results are presented relative to cells co-transfected with scr. (c) Genomic annotation of PU.1-binding sites defined by ChIP-seq analysis in primary human fibrotic fibroblasts. TSS, transcription start site. (d) Annotation of PU.1 ChIP-seq peaks (n = 3 each) at various q-value treshholds to active regulatory elements (AREs). For unbiased identification of AREs 11 ENCODE datasets from DNAse-seq and histone ChIP-seq were used as described in materials & methods; q-values are those provided by MACS2 call-peak. (e) Differentially expressed genes from gene sets of inflammatory fibroblasts co-transfected with PU.1 (PU.1 OE) or scr vector as control (ctrl); gene sets include fibrosis-associated, inflammatory and matrix-degrading pathways determined by qPCR (n = 4 each). Colors represent the significance levels of the observed changes of the respective expression levels in PU.1 OE compared to ctrl. (f) Micro-mass organoids of inflammatory fibroblasts co-transfected with PU.1 (PU.1 OE) or scr vector as control in the presence of TNF-α for 21 days (n = 8 each). Sections of micro-mass organoids were stained with hematoxylin & eosin. Lining fibroblasts were quantified relative to total number of cells per high power field (HPF). (g) 3D full skin organoid model of inflammatory fibroblasts co-transfected with PU.1 (PU.1 OE) or scr vector as control; EL: epidermal layer, DL: dermal layer; collagen content was measured by hydroxyproline assay; α-SMA and skin thickness were quantified per HPF (n = 4 each). (h) mRNA expression levels of indicated transcripts in primary human inflammatory fibroblasts treated with or without DB1976 and simultaneously co-transfected with or without miR-155 antagomirs (n = 4 each); results are presented relative to cells co-transfected with scrambled antagomirs (scr). Data are shown as the mean ± s.e.m. of respective n independent experiments. P values were determined either according to Subramanian et al. (a), by one-way ANOVA with Tukey's multiple comparison post hoc test (b, h) or two-tailed Mann–Whitney U test (e-g).
Extended Data Figure 6:
Extended Data Figure 6:. PU.1 anchors differentiation towards fibrotic fibroblasts in a network of flanking factors including TEAD1.
(a) TEAD1 expression levels of primary human fibroblasts. Representative Western Blot and semi-quantitative analysis of TEAD1 protein expression in resting, fibrotic and inflammatory fibroblasts (n = 4 each). (b) ChIP analysis of TEAD1 binding at fibrotic signature gene regions in the vicinity of PU.1 binding sites; DNA fragments of human fibrotic fibroblasts were immunoprecipitated with anti-TEAD1 and analyzed by qPCR relative to input DNA (n = 4 each); results are compared to IgG control. Signature pro-fibrotic genes were screened for PU.1 ChIP-seq peaks and potential flanking TEAD1 binding site. (c) mRNA expression levels of indicated transcripts in primary human inflammatory fibroblasts co-transfected with PU.1 (PU.1 OE) or scrambled (scr) plasmid (n = 4 each); cells were cultured under neutral conditions (serum-starved medium only) or in the presence of TGF-β (fibrotic) or TNF-α (‘inflam’, inflammatory). Results are presented relative to scr under neutral culture conditions. Data are shown as mean ± s.e.m. of respective n biologically independent samples. P values were determined either by one-way ANOVA with Tukey's multiple comparison post hoc test or two-tailed Mann–Whitney U test if two groups were compared.
Extended Data Figure 7:
Extended Data Figure 7:. PU.1-silencing in experimental fibrosis.
(a-f) Experimental fibrosis models; representative images of (a, b) trichrome or (c, d) sirius red stained tissue sections; mRNA levels of Col1a1 Col1a2, hydroxyproline content, myofibroblast counts, and respective histological scores (skin thickness, Ashcroft, Scheuer) of mice treated with/without DB1976. Mice treated with sodium chloride (NaCl) or oil served as controls (ctrl). (a, b) Bleomycin-induced skin fibrosis model with (a) preventive (n = 7) and (b) therapeutic (n = 8) treatment; in the latter regression of pre-established fibrosis was evaluated since mice were challenged with bleomycin for 3 weeks to induce robust skin fibrosis before treatment with DB1976 was initiated, while injections with bleomycin were continued. As additional control, mice were injected with bleomycin for 3 weeks followed by injections of NaCl for another 3 weeks. (c) Bleomycin-induced lung fibrosis model (n = 5); (d) CCl4-induced liver fibrosis model (n = 5); (e) body weight, (f) pain and distress levels of DB1976-treated mice as monitored every second day (n = 5 each); mice challenged with subcutaneous injections of bleomycin served as positive controls. Data are shown as the mean ± s.e.m. of respective n biologically independent samples. P values were determined by one-way ANOVA with Tukey's multiple comparison post hoc test.
Extended Data Figure 8:
Extended Data Figure 8:. Effects of DB1976 in anti-fibrotic concentrations on hematopoietic cells and bone marrow derived stem cells.
(a, c, e, g, i) Flow cytometric gating strategy to identify (a) different peripheral blood cells and (c) different splenic cell populations, (e) B cell precursors and mature B cells in the bone marrow, (g) T cell precursors and mature T cells in the thymus or (i) bone marrow derived mesenchymal stem cells (MSC) and hematopoietic stem cells (HSC) in mice treated with different concentrations of DB1976 or NaCl (n = 3 each) as control for 6 weeks; FMO = fluorescence minus one controls. (b) White blood count (WBC), red blood count (RBC), numbers of thrombocytes (TBC) and T-cell/B-cell ratio in the peripheral blood; (d) quantification of splenic monocytes (Mo), macrophages (Mph), dendritic cells (DC), and the T-cell/B-cell ratio; (f) frequencies of respective B cell populations as indicated; (h) frequency of respective thymocyte subsets; DN, double-negative thymocytes; DP, double-positive thymocytes; DN thymocytes according to the expression of CD25 and CD44; (j) percentage of LinCD29+CD105+ MSCs in the bone marrow; mean fluorescence intensity (MFI) of CD29+ MSCs; MFI of CD105+ MSCs; percentage of CD45+CD34+ HSCs in the bone marrow; data are shown as the mean ± s.e.m. of respective n biologically independent samples. P values were determined by one-way ANOVA with Tukey's multiple comparison post hoc test.
Extended Data Figure 9:
Extended Data Figure 9:. Characterization of cultured fibroblast phenotypes.
(a-c) Gating strategy of cultured human (a) resting, (b) fibrotic and (c) inflammatory fibroblasts stained for PDGFRα, Collagen I, vimentin (fibroblast markers) and for KRT14, CD31, CD45, CD326 (control markers). Respective isotype and corresponding positive controls for KRT14 (human keratinocytes), CD31 (human umbilical vein endothelial cells), CD45 (human peripheral blood mononuclear cells) and EpCAM (human kidney tubular epithelial cells) are included. (d, e) Proliferation, migration and invasion of different passages (P3, P5, P8) of human resting, fibrotic and inflammatory fibroblasts (n = 3 each) as assessed by xCELLigence Real Time Cell Analysis Instrument. Resting fibroblasts cultured in the absence of a gradient of chemoattractants served as controls. Data are shown as the mean ± s.e.m. of respective n biologically independent samples. P values were determined by one-way ANOVA with Tukey's multiple comparison post hoc test.
Extended Data Figure 10.
Extended Data Figure 10.. Control stainings of human and murine tissues.
Representative hematoxylin & eosin (HE) and immunofluorescence (IF) images of (a-c) paraffin-embedded human (a) skin, lung, liver, kidney and joint tissues or murine (b) skin, lung and liver tissues stained for DAPI and Ig controls as indicated (n = 5 each). (c) Representative images of HE stained and IF images of murine biopsy specimens (n = 5 each) of fibrotic skin, lung and liver stained for DAPI, α-SMA, Collagen I and CD31. (d-f) Representative HE and IF images of frozen tissue sections of control littermates or PU.1GFP reporter mice stained for DAPI (blue) in the mouse model of (d) bleomycin-induced skin fibrosis (n = 5 per group); controls received NaCl; (e) mouse model of bleomycin-induced lung fibrosis (n = 4 per group); controls received NaCl; (f) mouse model of CCl4-induced liver fibrosis (n = 4 per group); controls received oil.
Figure 1:
Figure 1:. PU.1 expression in leukocytes and fibroblasts from normal human tissues and tissues affected by inflammatory or fibrotic diseases.
(a) Motif binding analysis of 984 transcription factors (TF) within promoter sequences of differentially expressed genes in skin biopsy specimens from patients with systemic sclerosis (n = 61) compared to unaffected controls (n = 36) using HOMER findMotifs. Log2(FoldChange) expression of differentially expressed genes was calculated and a linear model with the formula log2(FoldChange) ~ MotifOccurrences performed. Transcription factors with significant enhanced motif occurrence (p-value; -log 10) in pro-fibrotic genes as assessed by ANOVA. (b-f) Representative immunofluorescence (IF) of (b, e, f) widefield and (d) confocal microscopy of human skin, lung, liver and kidney biopsy specimens stained for PU.1 (red), CD45 or P4Hβ (green), and DAPI (blue); respective tissues were obtained from healthy individuals (n = 5 each), patients with systemic sclerosis (n = 25), plaque psoriasis (n = 7), idiopathic pulmonary fibrosis (IPF; n = 4), acute asthma (n = 5), alcoholic liver cirrhosis (n = 4), autoimmune hepatitis (n = 4), cirrhotic kidney (n = 4) and interstitial nephritis (n = 5). Hematoxylin & eosin (HE) stained tissue specimens are included. (c) Semi-quantification of PU.1+ fibroblasts / total P4Hβ+ fibroblasts per high-power field (HPF); (e) Voronoi mesh based tessellated pictures amenable to computational simulation, IF microscopy images and histograms of respective IF signals; (g) Semi-quantification of PU.1+ fibroblasts per high-power field (HPF); 6 randomly chosen HPF of each slide (respective n is given in b-f) were used. Data are shown as the mean ± s.e.m from biologically independent samples. P values were determined by one-way ANOVA with Tukey's multiple comparison post hoc test.
Figure 2:
Figure 2:. Fibrogenic potential of PU.1-expressing fibroblasts.
(a) CRISPR-Cas9 mediated knockout (KO) of PU.1 in human fibrotic fibroblasts (n = 4 each); (b) PU.1-overexpressing (OE) human resting fibroblasts (n = 5 each); (a, b) KO and OE of PU.1 was measured by Western Blot analysis. Representative immunofluorescence images of fibroblasts stained for α-SMA (green), F-actin (red) and DAPI (blue) are included. Collagen production, α-SMA and F-actin expression were quantified. (c-f) Representative images of trichrome or sirius red stained tissue sections of fibrosis models of wild-type (WT) and PU.1fl/fl X Col1a2CreER (for skin models) or PU.1fl/fl X Col6Cre mice (for lung and liver models); (c) bleomycin-induced skin (n = 6 per group) and (d) lung fibrosis model (n = 6 per group); sodium chloride (NaCl) treated mice served as controls (ctrl). (e) Carbon tetrachloride (CCl4)-induced liver fibrosis model (n = 5 per group); mice treated with oil served as controls (ctrl). (f) Sclerodermatous chronic graft-versus-host disease (scl cGvHD) model (n = 6 per group); data are shown as the mean ± s.e.m. of respective n biologically independent samples. P values were determined by one-way ANOVA with Tukey's multiple comparison post hoc test.
Figure 3:
Figure 3:. Epigenetic and post-transcriptional regulation of PU.1 in human fibroblasts.
(a) Schematic diagram of the PU.1 gene locus; Pr, promoter; URE, −17kb upstream regulatory element; TSS, transcriptional start site, exons 1-5 (E1 – E5); Met, methylated CpG; (b-h) Ex vivo experiments with primary human resting, fibrotic and inflammatory fibroblasts. (b) DNA methylation analysis of Pr and URE (n = 3) in respective fibroblasts; (c) Occurrence of respective histone modifications at PU.1 promoter and URE as assessed by ChIP and qPCR relative to input DNA (n = 4 each). (d) Representative Western Blot and semi-quantitative analysis of PU.1 expression in resting, fibrotic and inflammatory fibroblasts in the presence or absence of GSK126 for 96 hours (n = 4). (e) Quantitative analysis of PU.1 mRNA levels (n = 8 each). (f) Prediction of miRNA binding sites within the PU.1 mRNA by miRWalk (n = 416 hits), Targetscan (n = 193 hits) and miRanda (n = 151 hits). The overlap of possible miRNAs from all 3 tools were further restricted to p ≤ 0.0233 predicted by miRWalk, (g) Respective miRNA expression levels relative to expression levels in resting fibroblasts (n = 4); (h) miR-155 reduction in inflammatory fibroblasts co-transfected with miR-155 specific or scrambled (scr) antagomirs as control (n = 5 each); (i) representative Western Blot and semi-quantitative analysis of PU.1 expression in inflammatory fibroblasts co-transfected with appropriate miR-155 specific or scr antagomirs. PU.1 expression is illustrated relative to β-actin (n = 4); (j) PU.1 mRNA expression levels of inflammatory fibroblasts in the presence and absence of miR-155 antagomirs (n = 4); data are shown as the mean ± s.e.m. of respective n biologically independent samples. P values were determined either by one-way ANOVA with Tukey's multiple comparison post hoc test or two-tailed Mann–Whitney U test if two groups were compared.
Figure 4:
Figure 4:. Regulation of pro-fibrotic genes by PU.1.
(a) ChIP of PU.1 binding at promoters of ACTA and COL1A1 analyzed by qPCR relative to input DNA (n = 4 each); (b) Chemical structure of DB1976 and the genomic consensus. (c) CCK-8 toxicity assay of human fibroblasts stimulated with DB1976 for 96h (n = 5). (d) Luciferase activity of human fibroblasts transfected with reporter vector containing the full promoter region of COL1A1 24 h after stimulation with/without DB1976 (n = 5 each). (e) Resting/fibrotic fibroblasts treated with/without DB1976 (hydroxyproline; α-SMA, F-actin per high power field (HPF) relative to control). Representative IF images (n = 4). (f-i) RNA-Seq of human fibrotic fibroblasts treated with/without DB1976 for 96h (n = 3 each); (f) heat map of pro-fibrotic gene signature. (g-i) Gene set enrichment analysis (GSEA) of RNA-Seq signals of GO-defined gene clusters; NES, normalized enrichment score; (j) hierarchical dendrogram of RNA-Seq profiles of resting/inflammatory/fibrotic fibroblasts stimulated with/without DB1976. (k) GSEA of resting fibroblasts co-transfected with PU.1 (OE) or scrambled vector (ctrl; n = 4 each); GO-defined gene signatures are assessed. (l) 3D full skin organoid model of human resting fibroblasts co-transfected with PU.1 or scrambled vector (n = 4 each); epidermal layer (EL) and dermal layer (DL) are marked. Collagen content (hydroxyproline assay); α-SMA, skin thickness quantified per HPF; data normalized to Ctrl; (m) Transcription factor binding motifs enriched in the 400 bp region surrounding the PU.1-binding sites that are specific for fibrotic fibroblasts using a random GC-corrected genomic background (n = 3 each). Data are shown as the mean ± s.e.m of respective n biologically independent samples. P values were determined either according to Subramanian et al. (g-i, k), Heinz et al. (m), by one-way ANOVA with Tukey's multiple comparison post hoc test (c-e) or two-tailed Mann–Whitney U test (a, l).

Comment in

References

    1. Driskell RR et al. Distinct fibroblast lineages determine dermal architecture in skin development and repair. Nature 504, 277–281, doi:10.1038/nature12783 (2013). - DOI - PMC - PubMed
    1. Kalluri R & Zeisberg M Fibroblasts in cancer. Nat Rev Cancer 6, 392–401 (2006). - PubMed
    1. Flavell SJ et al. Fibroblasts as novel therapeutic targets in chronic inflammation. British Journal of Pharmacology 153, S241–S246, doi:10.1038/sj.bjp.0707487 (2008). - DOI - PMC - PubMed
    1. Palumbo-Zerr K et al. Orphan nuclear receptor NR4A1 regulates transforming growth factor-beta signaling and fibrosis. Nat Med 21, 150–158, doi:10.1038/nm.3777 (2015). - DOI - PubMed
    1. Ramming A, Dees C & Distler JH From pathogenesis to therapy - Perspective on treatment strategies in fibrotic diseases. Pharmacol Res 100, 93–100, doi:10.1016/j.phrs.2015.06.012 (2015). - DOI - PubMed

Publication types