. 2019 Feb;566(7742):115-119.
doi: 10.1038/s41586-018-0849-9. Epub 2019 Jan 30.

Gut intraepithelial T cells calibrate metabolism and accelerate cardiovascular disease

Affiliations

Gut intraepithelial T cells calibrate metabolism and accelerate cardiovascular disease

Shun He et al. Nature. 2019 Feb.

Abstract

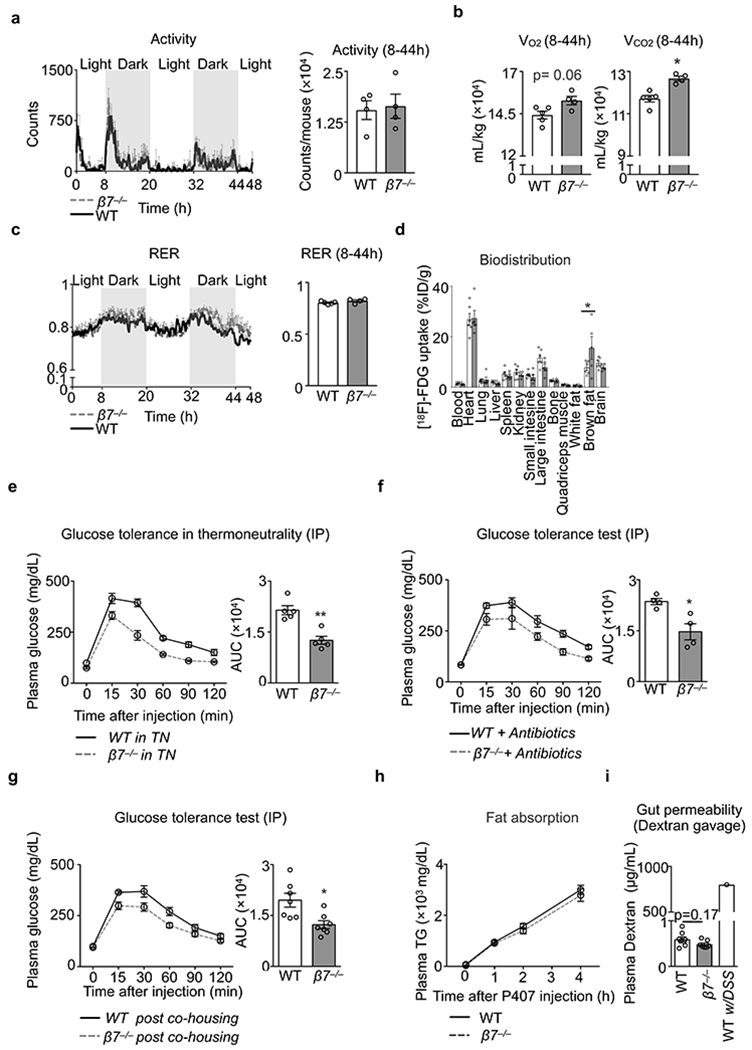
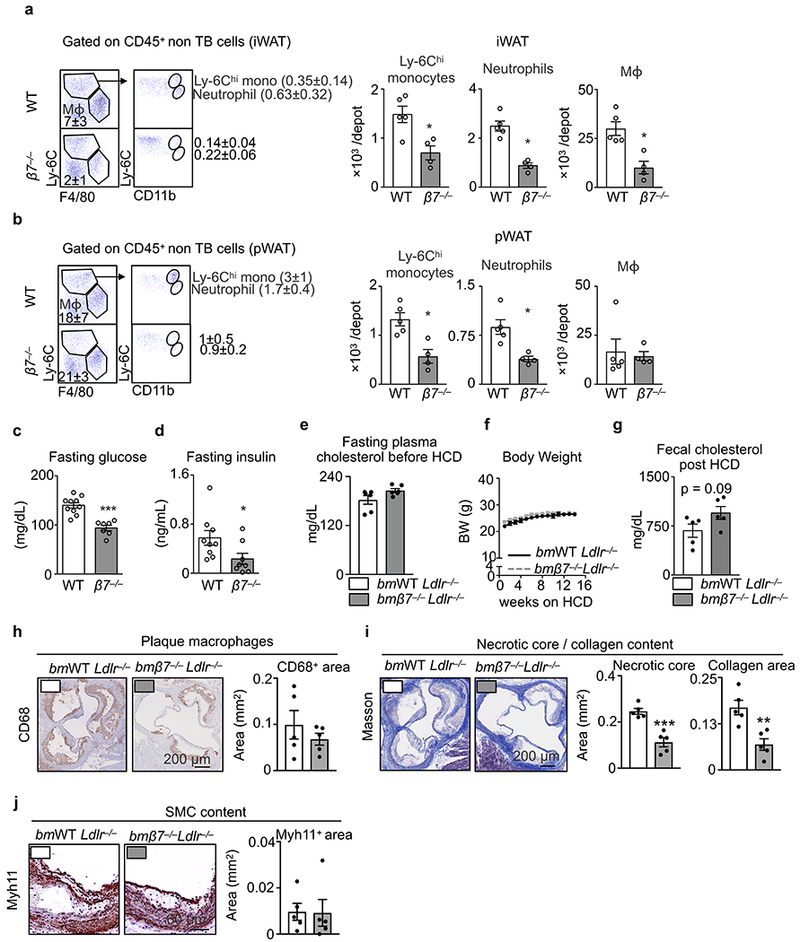
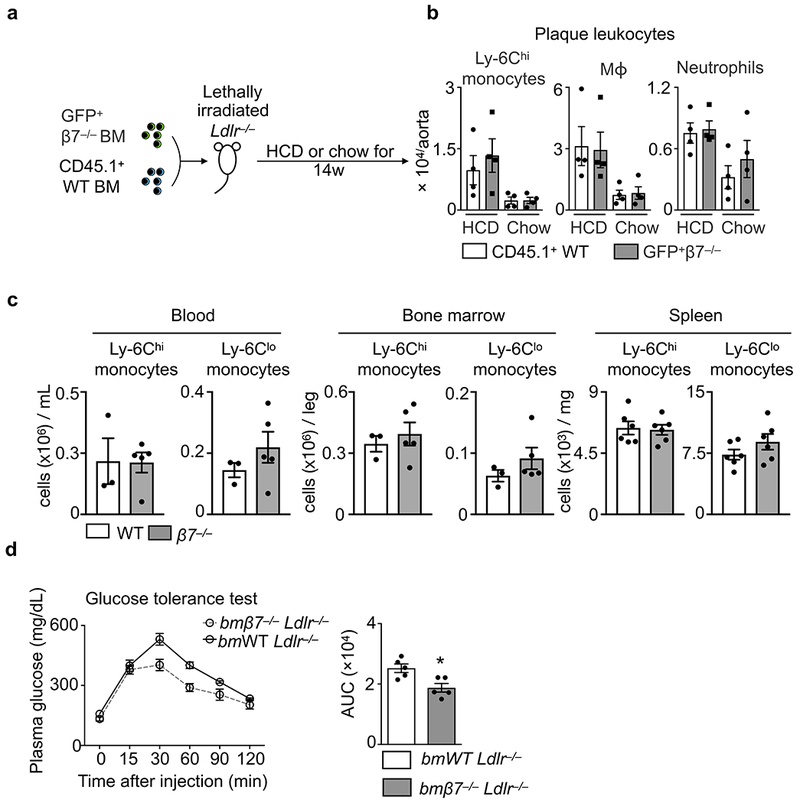
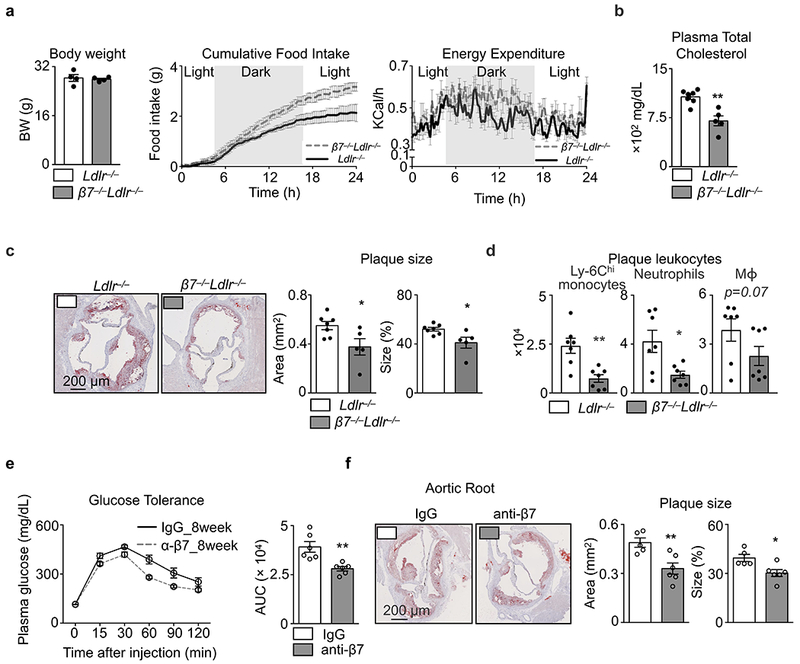
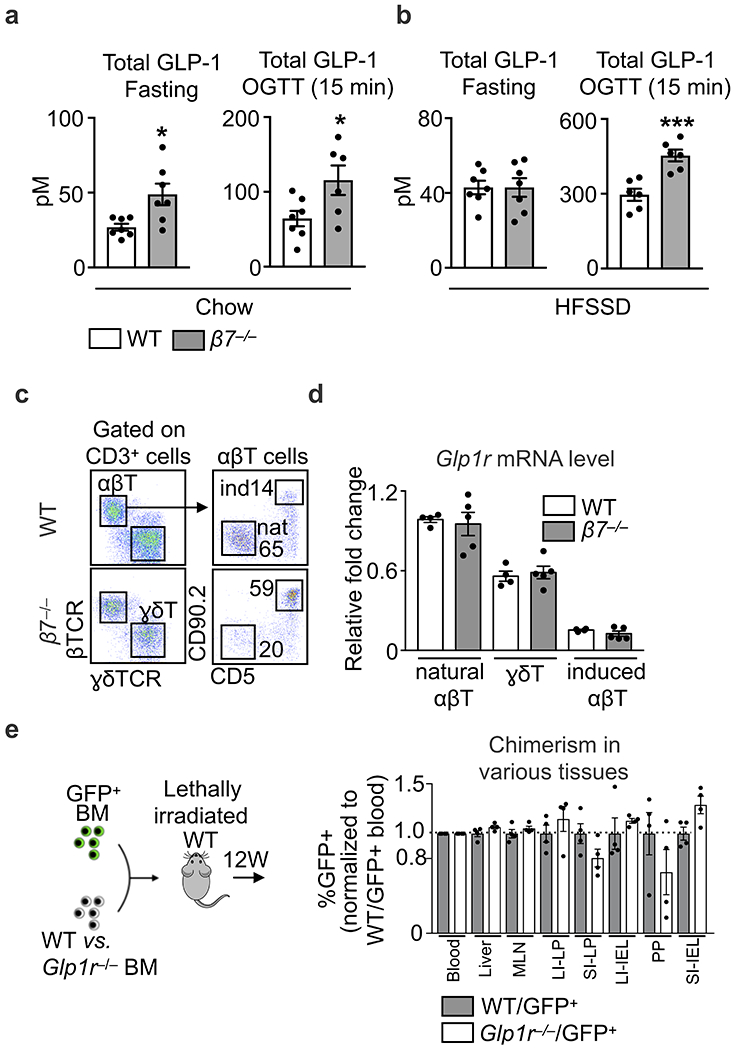
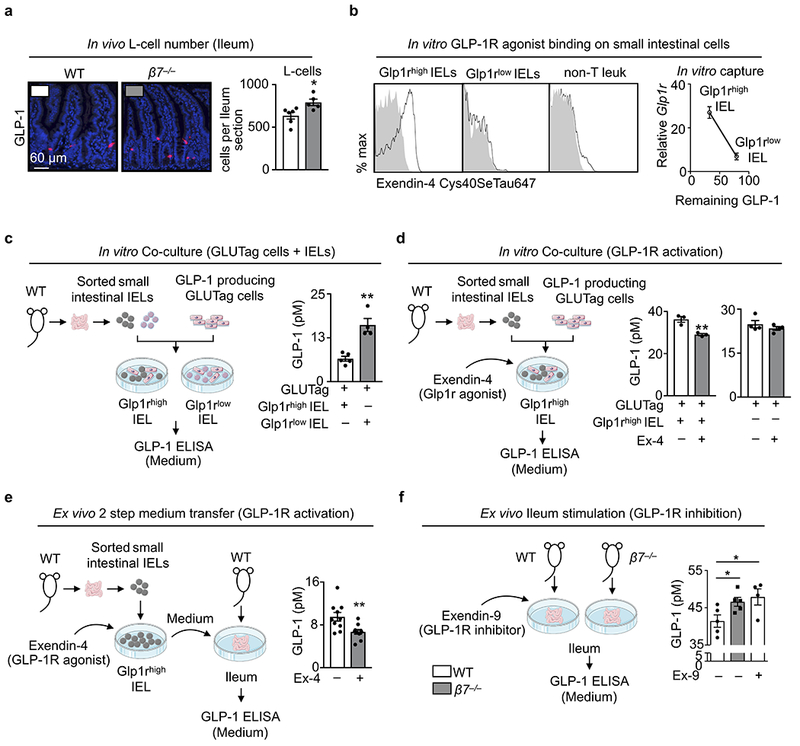
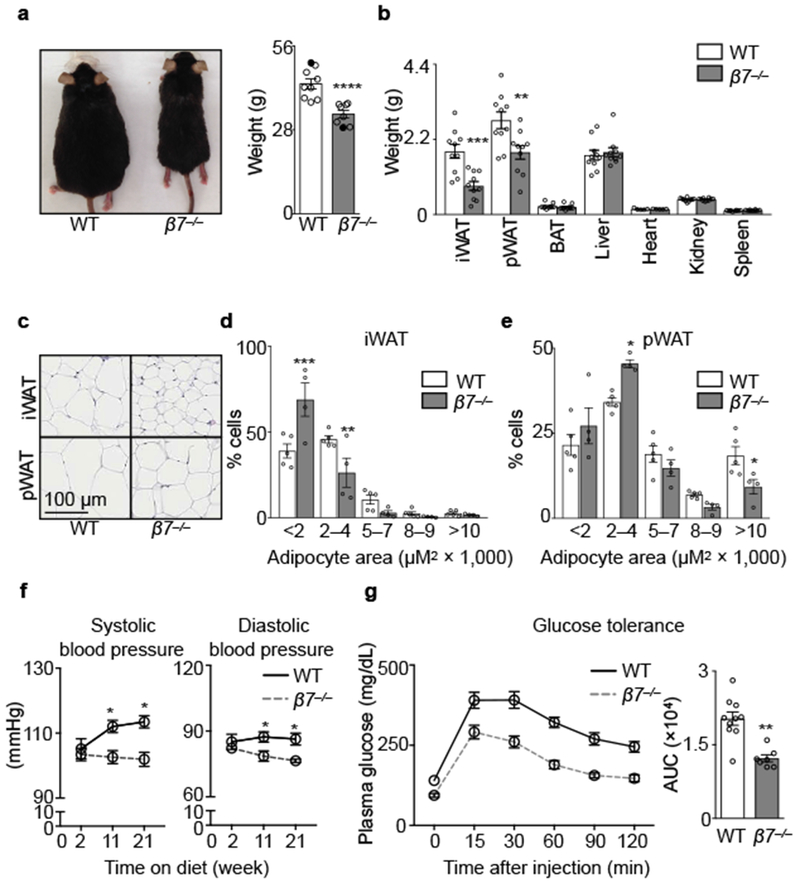
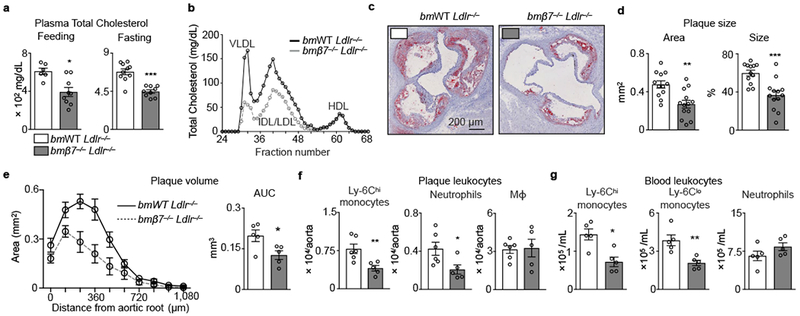
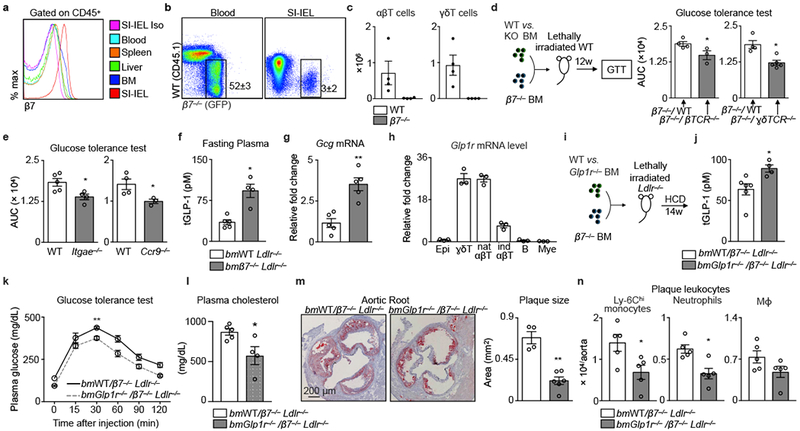
The biochemical response to food intake must be precisely regulated. Because ingested sugars and fats can feed into many anabolic and catabolic pathways1, how our bodies handle nutrients depends on strategically positioned metabolic sensors that link the intrinsic nutritional value of a meal with intermediary metabolism. Here we describe a subset of immune cells-integrin β7+ natural gut intraepithelial T lymphocytes (natural IELs)-that is dispersed throughout the enterocyte layer of the small intestine and that modulates systemic metabolism. Integrin β7- mice that lack natural IELs are metabolically hyperactive and, when fed a high-fat and high-sugar diet, are resistant to obesity, hypercholesterolaemia, hypertension, diabetes and atherosclerosis. Furthermore, we show that protection from cardiovascular disease in the absence of natural IELs depends on the enteroendocrine-derived incretin GLP-12, which is normally controlled by IELs through expression of the GLP-1 receptor. In this metabolic control system, IELs modulate enteroendocrine activity by acting as gatekeepers that limit the bioavailability of GLP-1. Although the function of IELs may prove advantageous when food is scarce, present-day overabundance of diets high in fat and sugar renders this metabolic checkpoint detrimental to health.


Conflict of interest statement

Competing Financial Interests

None.

Figures

Extended Data Figure 1.
Extended Data Figure 1.. Effects of integrin β7 deficiency on metabolism.
a, Metabolic cage measurements of activity (n = 4 mice per group, mean ± s.e.m), b, O2 consumption and CO2 production (n = 5 for WT and n = 4 for β7−/− mice, mean ± s.e.m) and c, respiratory exchange rate (RER) by CLAMS in WT and β7−/− mice on chow (n = 5 for WT and n = 4 for β7−/− mice, mean ± s.e.m, *P < 0.05, Mann-Whitney two-tailed test). d, Overnight fasted WT and β7−/− mice were administered with [18F]-FDG. The radioactivity in indicated organs was measured (n = 6 for WT and n = 5 for β7−/− mice, mean ± s.e.m, *P < 0.05, multiple t test). e, WT and β7−/− mice were housed in thermoneutral (TN) incubators for 3 days and then subjected to the glucose tolerance test. (n = 5 mice per group, mean ± s.e.m, **P < 0.01, Mann-Whitney two-tailed test). f, WT and β7−/− mice were treated with antibiotic cocktails in the drinking water for 4 weeks and then subjected to the glucose tolerance test. (n = 4 per group, mean ± s.e.m, *P < 0.05, Mann-Whitney two-tailed test). g, 8-week old WT and β7−/− mice were co-housed at a ratio of 1:1 for 4 weeks and then subjected to the glucose tolerance test. (n = 7 mice per group, mean ± s.e.m, *P < 0.05, Mann-Whitney two-tailed test). h, Fat absorption was performed by doing the fat tolerance test in the presence of P407 (n = 9 for WT and n = 6 for β7−/− mice, mean ± s.e.m). i, For assessment of permeability, mice were gavaged with FITC-dextran and fluorescence was measured in the plasma 4 h later. A WT mouse subjected to a colitis model (DSS) was used as a positive control for increased gut permeability. (n = 8 for WT and n = 7 for β7−/− mice, mean ± s.e.m, P = 0.17, Mann-Whitney two-tailed test).
Extended Data Figure 2.
Extended Data Figure 2.. Effects of integrin β7 deficiency on obesity, cholesterolemia and atherosclerosis.
a, Representative flow dot plots and quantification of Ly-6Chi monocytes, neutrophils and macrophages in iWAT of WT and β7−/− mice on HFSSD for 5 months (n = 5 for WT and n = 4 for β7−/− mice, mean ± s.e.m, *P < 0.05, Mann-Whitney two-tailed test). b, Representative flow dot plots and quantification of Ly-6Chi monocytes, neutrophils and macrophages in pWAT of WT and β7−/− mice on HFSSD for 5 months (n = 5 for WT and n = 4 for β7−/− mice, mean ± s.e.m, *P < 0.05, Mann-Whitney two-tailed test). c, Plasma glucose (n = 10 for WT and n = 7 for β7−/− mice, mean ± s.e.m, ***P < 0.001, Mann-Whitney two-tailed test), and d, insulin levels (n = 9 for WT and n = 8 for β7−/− mice, mean ± s.e.m, *P < 0.05, Mann-Whitney two-tailed test) measured in overnight fasted animals on HFSSD for 5 months. e, Fasting plasma total cholesterol levels on chow diet (n = 6 mice per group, mean ± s.e.m) and f, body weight changes during 14-week HCD diet of bmWT Ldlr−/− vs. bmβ7−/−Ldlr−/− mice (n = 5 mice per group, mean ± s.e.m). g, Fecal cholesterol levels in bmWT Ldlr−/− vs. bmβ7−/−Ldlr−/− mice after 14-week HCD diet (n = 5 mice per group, mean ± s.e.m, P = 0.09, two-tailed unpaired Student’s t-test). h, Representative images and histological quantification of macrophage, i, collagen content/ necrotic core and, j, smooth muscle cell content of bmWT Ldlr−/− vs. bmβ7−/−Ldlr−/− mice after 14 weeks on HCD (n = 5 mice per group, mean ± s.e.m).**P < 0.01, ***P < 0.001. P values from two-tailed unpaired Student’s t-test.
Extended Data Figure 3.
Extended Data Figure 3.. Effects of integrin β7 deficiency on myeloid cells and glucose tolerance.
a, Ldlr−/− mice were lethally irradiated and reconstituted with bone marrow mixtures of WT and β7−/− mice (1:1) and fed on chow or high-cholesterol diet (HCD) for 14 weeks. b, The aortic leukocytes from different origins were enumerated by flow cytometry (n = 4 mice for both HCD recipients and chow recipients, mean ± s.e.m). c, Ly-6Chi and Ly-6Clo monocyte numbers in blood (n = 3 for WT and n = 5 for β7−/− mice, mean ± s.e.m), bone marrow (n = 3 for WT and n = 5 for β7−/− mice, mean ± s.e.m) and spleen (n = 6 mice per group, mean ± s.e.m) of WT vs. β7−/− mice on chow diet. d, bmWT Ldlr−/− vs. bmβ7−/−Ldlr−/− mice on HCD were subjected to an intraperitoneal (IP) glucose tolerance test (n = 5 mice per group, mean ± s.e.m). *P < 0.05, Mann-Whitney two-tailed test.
Extended Data Figure 4.
Extended Data Figure 4.. Effects of genetic deficiency and blocking of integrin β7 on atherosclerosis.
a, Body weights, cumulative food intake, and energy expenditure were measured in Ldlr−/− mice and β7−/− Ldlr−/− mice (n = 4 mice per group, mean ± s.e.m). b, Ldlr−/− mice and β7−/− Ldlr−/− mice were fed HCD for 14 weeks. Plasma cholesterol levels were determined in overnight fasted mice (n = 7 for Ldlr−/− and n = 5 for β7−/− Ldlr−/− mice, mean ± s.e.m, **P < 0.01, Mann-Whitney two-tailed test). c, Representative Oil-red O staining images and quantification of plaque size in the aortic roots (n = 7 for Ldlr−/− and n = 5 for β7−/− Ldlr−/− mice, mean ± s.e.m, *P < 0.05, Mann-Whitney two-tailed test). d, Quantification of Ly-6Chi monocytes, neutrophils, and macrophages in plaques (n = 7 mice per group). e, Ldlr−/− mice on HCD were treated with anti-β7 antibodies or IgG isotype control (500 μg/mouse/week) for 14 weeks. Mice were subjected to glucose tolerance test (i.p.) after 8 weeks on HCD (n = 6 mice per group, mean ± s.e.m, **P < 0.01, Mann-Whitney two-tailed test). f, Representative images of Oil-red O stained aortic cross sections and quantification of plaque size in the aortic roots after 14 weeks on HCD (n = 5 for IgG and n = 6 for anti-β7 mice, mean ± s.e.m), *P < 0.05, **P < 0.01, Mann-Whitney two-tailed test.
Extended Data Figure 5.
Extended Data Figure 5.. Integrin β7 guides leukocytes to gut intraepithelium.
a, Representative histology staining for CD3 in small intestines of WT mice and β7−/− mice. Bottom panel shows the quantification of CD3+ cells in each villus (over 15 villi were counted for each mouse), ***P < 0.001, two-way ANOVA. b, The scheme of the competitive transfer: Mice (CD45.2+) were lethally irradiated and transplanted with 1:1 ratio mix of GFP+/+β7−/− bone marrows and CD45.1+WT bone marrows. The chimerism in different tissues was normalized by comparing the ratio in blood (n = 5 mice, mean ± s.e.m). c, Representative flow dot plots and quantification of B cells and myeloid cells in mice depicted in (b) (n = 5 biologically independent recipients, mean ± s.e.m). d, Quantification of ɣδT cells from the liver (n = 3 WT vs. 4 β7−/− mice, mean ± s.e.m) and e, pancreas (n = 4 WT vs. 5 β7−/− mice, mean ± s.e.m). f, WT mice were lethally irradiated and reconstituted with BM cell mixtures of β7−/− and WT (β7−/−/ WT, 1:1 ratio) or β7−/− and indicated KOs (β7−/−/ KO, 1:1 ratio). The indicated mixed chimeras that specifically lack intestinal B cell (β7−/−/ μMt) or myeloid cells (β7−/−/ Ccr2−/−) were subjected to oral glucose tolerance tests and the AUCs are shown. (n = 5 per group for β7−/−/ WT vs β7−/−/ μMt, and n = 4 per group for β7−/−/ WT vs β7−/−/ Ccr2−/− mice).
Extended Data Figure 6.
Extended Data Figure 6.. B cells are dispensable for the altered metabolic phenotypes in integrin β7 deficient mice.
Ldlr−/− mice were lethally irradiated and reconstituted with BM cell mixtures of β7−/− and WT (β7−/−/ WT, 1:1 ratio), or, β7−/− and μMt (β7−/−/μMt, 1:1 ratio). The reconstituted mixed chimeras were fed on high-cholesterol diet (HCD) for 14 weeks. a, IgA levels in the gut flush (n = 5 for β7−/−/ WT vs n = 4 β7−/−/ μMt mice, mean ± s.e.m) and the plasma (n = 5 for β7−/−/ WT vs n = 3 β7−/−/ μMt mice, mean ± s.e.m), **P < 0.01, Mann-Whitney two-tailed test. b, Number of IgD+ B cells in Peyer’s patches and IgA+ B cells and IgD+ B cells in lamina propria as determined by flow cytometry (n = 5 for β7−/−/ WT vs n = 3 β7−/−/ μMt mice, mean ± s.e.m), *P < 0.05, Mann-Whitney two-tailed test. c, Glucose tolerance test in HCD-fed mixed chimeras (n = 5 for β7−/−/ WT vs n = 3 β7−/−/ μMt mice, mean ± s.e.m). d, Plasma cholesterol levels in overnight-fasted mice (n = 5 for β7−/−/ WT vs n = 4 β7−/−/ μMt mice, mean ± s.e.m). e, Representative images and quantification of Oil-red O staining in aorta root sections of bmβ7−/−/ WT Ldlr−/− and bmβ7−/−/ μMt Ldlr−/− mice on HCD for 14 weeks (n = 5 for β7−/−/ WT vs n = 4 β7−/−/ μMt mice, mean ± s.e.m).
Extended Data Figure 7.
Extended Data Figure 7.. Integrin β7 deficiency and GLP-1.
a, Plasma total GLP-1 levels after overnight fasting and 15 minutes following oral glucose load (2 g/kg body weight) in WT and β7−/− mice on chow (Total GLP-1 fasting: n = 7 mice per group, mean ± s.e.m; Total GLP-1 OGTT 15 min: 7 WT vs. 6 β7−/− mice, mean ± s.e.m) and b, after 5 months of high-fat, high-sugar and high-sodium diet (HFSSD) (Total GLP-1 fasting: n = 7 mice per group, mean ± s.e.m; Total GLP-1 OGTT 15 min: 6 mice per group, mean ± s.e.m. c, Representative flow cytometry dot-blots of small intestinal IELs from WT and β7−/− mice. d, Glp1r mRNA levels in sorted different IEL subsets from WT and β7−/− mice (n = 4 WT vs n = 5 β7−/− mice, mean ± s.e.m). e, WT mice were lethally irradiated and transplanted with 1:1 BM mixture of WT and GFP+, Glp1r−/− and GFP+, respectively. The chimerism in different tissues was analyzed by comparing the percentage of GFP+ leukocytes normalized to WT/GFP+ blood leukocytes (n = 4 mice per group, mean ± s.e.m). *P < 0.05, ***P < 0.001. All P values from two-tailed unpaired Student’s t-test.
Extended Data Figure 8.
Extended Data Figure 8.. Effects of Glp1r deficiency on IELs and atherosclerosis.
a, Quantification of small intestinal IEL subpopulations in bmWT/ β7−/− Ldlr−/− and bmGlp1r−/− /β7−/− Ldlr−/− mice (n = 5 mice per group, mean ± s.e.m). b, Glp1r mRNA expression from sorted IEL subpopulations from biologically independent 4 bmWT/ β7−/− and 5 bmGlp1r−/− /β7−/− mice (mean ± s.e.m, two-tailed unpaired Student’s t-test). c, Glp1r mRNA expression of liver (from 5 bmWT/ β7−/− and 4 bmGlp1r−/− /β7−/− mice) and heart and lung tissue (n = 5 mice per group, mean ± s.e.m). d, Quantification of ɣδT cells from the liver (n = 5 mice per group, mean ± s.e.m) and pancreas of 5 bmWT/ β7−/− Ldlr−/− and 4 bmGlp1r−/− /β7−/− Ldlr−/− mice (mean ± s.e.m). e, Glp1r mRNA expression of sorted ɣδT cells from pancreas, liver and small intestinal IELs (n = 3 mice per group, mean ± s.e.m, two-tailed unpaired Student’s t-test). f, Oral glucose tolerance test in 4 bmWT and 3 bmGlp1r−/− mice (mean ± s.e.m) g, GLP-1 levels after overnight fasting (n = 4 mice per group, mean ± s.e.m) or oral glucose challenge 4 bmWT and 3 bmGlp1r−/− mice (mean ± s.e.m). h, Oral glucose tolerance test in bmWT/ β7−/− and bmGlp1r−/−/β7−/− mice (n = 5 mice per group, mean ± s.e.m, two-tailed Mann-Whitney test). i, GLP-1 levels after overnight fasting or oral glucose challenge in bmWT/ β7−/− and bmGlp1r−/−/β7−/− mice (n = 5 mice per group, mean ± s.e.m, two-tailed unpaired Student’s t-test). j, Ldlr−/− mice were treated with GLP-1R agonist Exendin-4 (Ex-4) at a dose of 100 μg/kg/day via osmotic mini pumps (PBS as control). After 8 weeks on HCD mice were sacrificed for atherosclerotic lesion quantification. Representative images of Oil-red O stained aortas and quantification of plaque size. k, Quantification of blood Ly-6Chi monocytes, Ly-6Clo monocytes and neutrophils (n = 8 Ldlr−/− mice treated with Ex-4 vs. 6 Ldlr−/− mice with PBS as control, mean ± s.e.m, two-tailed unpaired Student’s t-test). *P < 0.05, **P < 0.01, ***P < 0.001.
Extended Data Figure 9.
Extended Data Figure 9.. Gut intraepithelial Glp1rhigh IELs regulate GLP-1 bioavailability.
a, Immunohistochemical staining for GLP-1-producing L-cells in whole ileum preparations of 6 WT and 5 β7−/− mice (mean ± s.e.m). b, Small intestinal IEL mixtures were incubated with fluorescence (Cys40SeTau647)-labelled GLP1-R agonist Exendin-4 and the capacity of agonist binding by the different subsets: natural IELs (Glp1rhigh), induced IELs (Glp1rlow), and non-T cells were analyzed by flow cytometry. Sorted Glp1rhigh and Glp1rlow were also incubated with recombinant GLP-1 and the remaining supernatant GLP-1 were plotted against their relative Glp1r mRNA levels. c, GLP-1-producing GLUTag cells were co-cultured with sorted natural (Glp1rhigh) or induced (Glp1rlow) IELs. After 24h supernatant GLP-1 concentrations were measured (n = 5 biologically independent samples for Glp1rhigh IELs and 4 biologically independent samples for Glp1rlow IELs, mean ± s.e.m). d, Left: GLUTag cells were co-cultured with sorted Glp1rhigh IELs in the presence of Exendin-4 (100 nM) or control (n = 3 independent biologically samples per group, mean ± s.e.m). Right: GLUTag cells were stimulated with Exendin-4 (100 nM) or control (n = 4 independent biological samples per group, mean ± s.e.m). After 24h supernatant GLP-1 levels were measured. e, Sorted Glp1rhigh IELs were incubated with Exendin-4 (100 nM) or control. After 24h samples were centrifuged and supernatants were transfered to ex vivo ileum fractions of WT mice. GLP-1 levels were determined 24h later from ex vivo supernatants (n = 10 biologically independent mice per group, mean ± s.e.m). f, Whole gut preparations of WT or β7−/− mice were treated with or without the GLP-1R antagonist Exendin-9 (100 nM). After 24h supernatant GLP-1 concentrations were measured. (n = 5 biologically independent samples for WT or β7−/− mice without Exendin-9, and n = 4 biologically independent samples for WT mice with Exendin-9, mean ± s.e.m). *P < 0.05, **P < 0.01. All P values from two-tailed unpaired Student’s t-test.
Extended Data Figure 10. Model.
In this study we propose that β7-dependent Glp1rhigh IELs residing in the small intestine modulate dietary metabolism in part by restricting GLP-1 bioavailability. The illustration was modified from Servier Medical Art (http://smart.servier.com/), licensed under a Creative Common Attribution 3.0 Generic License.
Figure 1.
Figure 1.. Integrin β7 regulates metabolism.
a, Body weight, b, Cumulative food intake, c, Energy expenditure and d, Heat production in WT and β7−/− mice consuming chow (n = 5 mice per group). e, Representative (of 6 and 5) PET/CT images after [18F]-FDG administration to WT and β7−/− mice. f, Standard update values (SUV) quantified in vivo in indicated regions of interest (ROI) (n = 6 WT; n = 5 β7−/− mice). g, Left: glucose tolerance test in WT and β7−/− mice consuming chow after i.p. glucose injection; right: Area under curve (AUC) of ipGTT. (n = 17 WT; n = 16 β7−/− mice). h, Plasma insulin levels in WT and β7−/− mice 15 min after glucose stimulation (n = 4 WT; n = 5 β7−/− mice). i, Insulin tolerance test in WT and β7−/− mice on chow (n = 5 WT and n = 4 β7−/− mice). j, Plasma triglyceride (TG) levels of fasted WT and β7−/− mice (n = 31 WT; n = 27 β7−/− mice). k, Fat tolerance test in WT and β7−/− mice on chow after i.p. injection of 20% Intralipid (n = 5 mice per group) ***P < 0.001, Two-way ANOVA test. l, Hepatic triglyceride (TG) secretion. Overnight fasted WT and β7−/− mice were injected i.p. with lipase inhibitor Poloxamer 407 and the plasma TG levels were determined at indicated time points (n = 4 WT; n = 3 β7−/− mice). Data presented as mean ± s.e.m, *P<0.05, **P < 0.01,***P < 0.001, ****P < 0.0001, Mann-Whitney two-tailed tests unless otherwise indicated.
Figure 2.
Figure 2.. Integrin β7 deficiency protects from metabolic syndrome.
a, Body weights of WT and β7−/− mice consuming HFSSD for 5 months (n = 9 WT; n = 8 β7−/− mice). The representative pictures of WT and β7−/− mice are shown on the left. Black dots denote pictured animals. b, Tissue weights of WT and β7−/− mice after 5 months of HFSSD (n = 10 mice per group, except heart n = 5). c, Representative H&E images of inguinal white adipose tissue (iWAT) and perigonadal white adipose tissue (pWAT) of WT (of 5) and β7−/− (of 4) mice on HFSSD for 5 months. d-e, Quantification of adipocytes at indicated size ranges in iWAT and pWAT of WT and β7−/− mice on HFSSD for 5 months (n = 5 WT; n = 4 β7−/− mice). Nonparametric multiple comparisons test was used. f, Blood pressure measurements of mice consuming HFSSD at indicated time points (n = 5 mice per group). g, Glucose tolerance test in WT and β7−/− mice consuming HFSSD for 5 months by oral glucose gavage (2 g/kg body weight); right: AUC of GTT. (n = 10 WT; n = 7 β7−/− mice). Data presented as mean ± s.e.m, *P<0.05, **P < 0.01,***P < 0.001, ****P < 0.0001, Mann-Whitney two-tailed tests unless otherwise indicated.
Figure 3.
Figure 3.. Integrin β7 deficiency protects against atherosclerosis.
Ldlr−/− mice were lethally irradiated and reconstituted with bone marrow (BM) cells from either WT (bmWT Ldlr−/− ) or β7−/− (bmβ7−/− Ldlr−/−) mice. a, Plasma cholesterol in feeding and overnight-fasted animals consuming high-cholesterol diet (HCD) for 14 weeks (n = 6 bmWT Ldlr−/− , n = 9 bmβ7−/− Ldlr−/− mice while feeding; n = 10 bmWT Ldlr−/−, n = 9 bmβ7−/− Ldlr−/− mice while fasting). b, Plasma lipoprotein distribution measured by FPLC in bmWT Ldlr−/− and bmβ7−/− Ldlr−/− mice. Plasma from n = 5 mice per group was pooled. c, Representative images, and d, quantification of Oil-red O staining of aortic root sections from bmWT Ldlr−/− and bmβ7−/− Ldlr−/− mice consuming HCD for 14 weeks (n = 12 bmWT Ldlr−/− ; n = 13 bmβ7−/− Ldlr−/− mice). e, Plaque volume calculated by measuring plaque size at increasing distances from the aortic root (n = 5 mice per group).*P < 0.05, two-tailed unpaired Student’s t test. f, Leukocyte quantification in aortas, and g, blood of bmWT Ldlr−/− and bmβ7−/− Ldlr−/− mice consuming HCD for 14 weeks (n = 6 bmWT Ldlr−/− and 5 bmβ7−/− Ldlr−/− in f; 5 mice per group in g). Data presented as mean ± s.e.m, *P<0.05, **P < 0.01,***P < 0.001, Mann-Whitney two-tailed tests unless otherwise indicated.
Figure 4.
Figure 4.. Natural IELs calibrate metabolism and protect against cardiovascular disease via GLP-1.
a, Histogram (of 4) showing β7 expression on leukocytes in WT mice. b, Flow dot plots showing leukocyte chimerism in blood and among small intestine intraepithelial leukocytes (SI-IEL). CD45.2+ mice were lethally irradiated and transplanted with a 1:1 ratio mixture of GFP+ β7−/− and CD45.1+ WT bone marrow. c, T cell quantification in SI in same mice as b (n = 4 recipient mice). d, WT mice were lethally irradiated and reconstituted with BM cell mixtures to generate mixed chimeric mice. Data show glucose tolerance tests and the AUC in β7−/− WT (n = 4 mice), β7−/− βTCR−/− (n = 3 mice), β7−/− γδTCR−/−(n = 5 mice). e, Glucose tolerance test (i.p.) in WT (n = 4 and 5 mice) and Itgae−/− (n = 4 mice) or Ccr9−/− mice (n = 3 mice). f, Fasting plasma total GLP-1 and g, Gcg mRNA in the ileum of bmWT Ldlr−/− (n = 5 mice) and bmβ7−/− Ldlr−/− (n = 4 and 5 mice) mice consuming HCD for 14 weeks. h, Glp1r in sorted IEL cells from WT mice (n = 3 mice). i, Experimental setup for generating mixed bone marrow chimeras. j, Fasting plasma total GLP-1 (n = 6 bmWT/β7−/− Ldlr−/− ; 4 bmGlpr1−/−/β7−/− Ldlr−/− mice). k, Glucose tolerance test (n = 5 mice). l, Plasma cholesterol (n = 5 bmWT/β7−/− Ldlr−/− ; 4 bmGlpr1−/−/β7−/− Ldlr−/− mice, mean ± s.e.m, *P < 0.05, two-tailed unpaired Student’s t test). m, Representative images and quantification of Oil-red O-stained aortic roots (n = 4 bmWT/β7−/− Ldlr−/− ; 6 bmGlpr1−/−/β7−/− Ldlr−/− mice). (n) Leukocyte quantification in aortas (n = 5 mice). For (k-n), mice consuming HCD. All data mean ± s.e.m, *P < 0.05, **P < 0.01, Mann-Whitney two-tailed tests unless otherwise indicated.

Comment in

Similar articles

Cited by

References

    1. Begg DP & Woods SC The endocrinology of food intake. Nat Rev Endocrinol 9, 584–597 (2013). - PubMed
    1. Drucker DJ The Cardiovascular Biology of Glucagon-like Peptide-1. Cell Metab 24, 15–30 (2016). - PubMed
    1. Cerf-Bensussan N, Begue B, Gagnon J & Meo T The human intraepithelial lymphocyte marker HML-1 is an integrin consisting of a beta 7 subunit associated with a distinctive alpha chain. Eur J Immunol 22, 885 (1992). - PubMed
    1. Cheroutre H, Lambolez F & Mucida D The light and dark sides of intestinal intraepithelial lymphocytes. Nat Rev Immunol 11, 445–456 (2011). - PMC - PubMed
    1. Holzmann B, McIntyre BW & Weissman IL Identification of a murine Peyer’s patch--specific lymphocyte homing receptor as an integrin molecule with an alpha chain homologous to human VLA-4 alpha. Cell 56, 37–46 (1989). - PubMed

Publication types

MeSH terms