. 2019 Feb;566(7742):120-125.
doi: 10.1038/s41586-019-0898-8. Epub 2019 Jan 30.

A quantitative approach for measuring the reservoir of latent HIV-1 proviruses

Affiliations

A quantitative approach for measuring the reservoir of latent HIV-1 proviruses

Katherine M Bruner et al. Nature. 2019 Feb.

Abstract

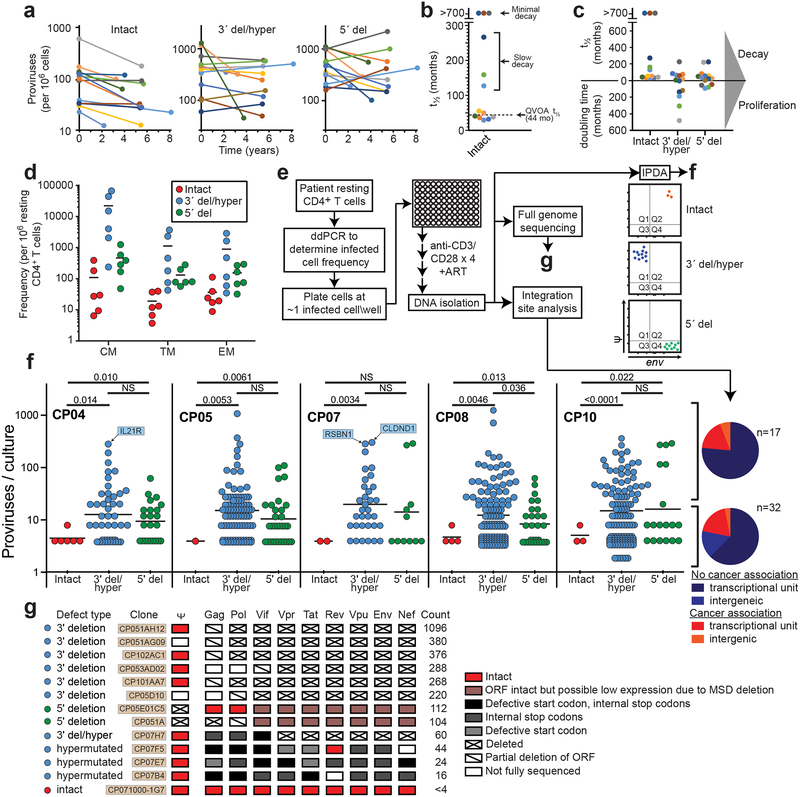
A stable latent reservoir for HIV-1 in resting CD4+ T cells is the principal barrier to a cure1-3. Curative strategies that target the reservoir are being tested4,5 and require accurate, scalable reservoir assays. The reservoir was defined with quantitative viral outgrowth assays for cells that release infectious virus after one round of T cell activation1. However, these quantitative outgrowth assays and newer assays for cells that produce viral RNA after activation6 may underestimate the reservoir size because one round of activation does not induce all proviruses7. Many studies rely on simple assays based on polymerase chain reaction to detect proviral DNA regardless of transcriptional status, but the clinical relevance of these assays is unclear, as the vast majority of proviruses are defective7-9. Here we describe a more accurate method of measuring the HIV-1 reservoir that separately quantifies intact and defective proviruses. We show that the dynamics of cells that carry intact and defective proviruses are different in vitro and in vivo. These findings have implications for targeting the intact proviruses that are a barrier to curing HIV infection.


Conflict of interest statement

Competing interests Aspects of IPDA are subject of patent application PCT/US16/28822 filed by Johns Hopkins University. KMB and RFS are inventors on this application. Accelevir Diagnostics holds an exclusive license for this patent application. GML is an employee of and shareholder in Accelevir Diagnostics. RFS holds no equity interest in Accelevir Diagnostics. RFS is a consultant on cure-related HIV research for Merck and Abbvie.

Figures

Extended Data Fig. 1.
Extended Data Fig. 1.. Analysis of hypermutation.
(a) The majority of hypermutated proviruses show both GG→AG and GA→AA patterns of hypermutation. Based on hypermutated full-genome sequences in the database (n=100). Sequences were analyzed for GG→AG and GA→AA patterns using the using the all available sequence for each clone and the Los Alamos hypermut algorithm. (b) Hypermutation discrimination using two probes in the RRE of the env gene. The intact probe hybridizes with a region containing two adjacent APOBEC3G consensus sites (red underline) in intact proviruses. It is labeled with a fluorophore (VIC) and a quencher (Q). Also present in the reaction is a hypermutated probe which lacks the fluorophore and which does not bind (arrow) to intact proviral sequences due to G→A mutations at both APOBEC3G consensus sites. Dashed boxes indicate the nucleotide positions of sequence differences between the intact and hypermutated probes. The hypermutated probe preferentially binds to the same region in hypermutated proviruses. It lacks a fluorophore and prevents binding of the fluorophore-labeled intact probe (arrow). Therefore, no fluorescent signal is generated for 95% of hypermutated proviruses (Fig. 2f).
Extended Data Fig. 2.
Extended Data Fig. 2.. Plasmid controls show the specificity of the IPDA.
(a) Maps of proviral plasmid control templates. Plasmids E44E11, 39G2, and 4F11 have deletions in the indicated regions (white). Plasmid 2G10 is a heavily hypermutated patient-derived sequence with G→A mutations in probe binding region of the env amplicon (enlarged region). Plasmid 19B3 has GA point mutations in this region. These G→A mutations (red) occur at two APOBEC3G consensus sites (TGGG, underlined) in this region. These plasmids have been previously described,. (b-e) IPDA on plasmids representing the indicated defective proviruses showing positive droplets only in the expected quadrants.
Extended Data Fig. 3.
Extended Data Fig. 3.. IPDA accuracy, reproducibility, and limit of quantification.
(a) Correlation between expected and IPDA-measured frequencies of intact proviruses per 106 cells. Genomic DNA from uninfected donor CD4+ T-cells was spiked with JLat6.3 DNA cell equivalents and subjected to a serial four-fold dilution. This material was then analyzed by the IPDA, and the IPDA-measured frequencies of intact proviruses per million cells were compared to the expected frequencies (998, 249.5, 62.4, 15.6, and 3.9 intact proviruses per 106 CD4+ T-cells). This experiment was performed independently three times. The agreement between the expected and IPDA-measured frequencies of intact proviruses was determined using Pearson correlation. (b) Reproducibility of the IPDA across independent assay runs. Reproducibility was assessed by determining the coefficient of variation (CV) across three independent assay measurements of genomic DNA from uninfected donor CD4+ T-cells spiked with JLat6.3 cell equivalents and subject to serial four-fold dilution, as described in (a).
Extended Data Fig. 4.
Extended Data Fig. 4.. IPDA reproducibility.
Frequencies of cells containing proviruses with 3′ deletions and/or hypermutation (a), 5′ deletions (b), or no defects (intact, c) in CD4+ T-cells from 28 treated patients. Each data point represents a replicate IPDA determination from a single sample from the indicated patient. The mean and SEM of the replicates are plotted. The variability between patients is much greater than the variation between replicates from a single patient. Technical replicates are shown to indicate low intrinsic variability of the IPDA.
Extended Data Fig. 5.
Extended Data Fig. 5.. Plasmid controls confirm specificity of the IPDA.
(a) Map of the plasmid pNL4–3 carrying an intact HIV-1 provirus. Positions of the Ψ (blue) and env (green) IPDA amplicons and of a distinct set of plasmid shearing control (PSC, magenta boxes) amplicons are indicated. Spacing between PSC amplicons is equal to spacing between Ψ and env amplicons. Dotted lines indicate positions of deletions in plasmids carrying previously described defective proviruses E44E11 and 4F12 with 5′ and 3′ deletions, respectively. (b) IPDA analysis of the indicated Zra1-cut plasmids representing intact, 5′-deleted and 3′-deleted proviruses. (c) Summary of droplet counts for the experiment shown in (b). E44E11 and 4F12 give positive droplets only in quadrant 4 (Q4) and Q1, respectively. For pNL4–3, >95% of droplets are in Q2, with the remainder attributable to shearing between the Ψ and env amplicons. (d) Analysis of shearing. For IPDA analysis of patient samples, shearing was measured using amplicons in the RPP30 gene (Fig. 3a,d,e). For plasmid control experiments, shearing of ZraI-cut plasmids was analyzed using two sets of amplcons, the Ψ and env IPDA amplicons and the equally spaced PSC amplicons shown in (a). ddPCR analysis was done on fresh (D0) maxipreps of pNL4–3 linearized with ZraI at a concentration mimicking patient samples. To assess the effects of higher levels of DNA fragmentation, IPDA analysis was also done on pNL4–3 DNA that had been incubated at 4oC for 5 days (D5), and on pNL4–3 DNA cut with both ZraI and EcoRI (2 cuts). The mean and range of duplicate determinations of the DNA shearing index (DSI) is shown for each set of amplicons. The DSI was the same for the IPDA and PSC amplicons at 3 different levels of shearing. The DSI was used to correct the IPDA droplet counts in (e). Negative values were set to 0. (e) Uncorrected and DSI-corrected IPDA analysis of the intact proviral construct pNL4–3 at different levels of fragmentation. After correction, positive droplets were almost exclusively in Q2 even at higher levels of fragmentation.
Extended Data Fig. 6.
Extended Data Fig. 6.. Sequence analysis of Q2 proviruses.
(a) Sorting of productively infected CD4+ T-cells. Cell preparations with a high fraction of intact proviruses were obtained by infecting CD4+ T-lymphoblasts with a replication-competent HIV-1 carrying GFP in the nef ORF (R7-GFP37). After 48 hours, GFP+ cells were collected by sorting. Genomic DNA was isolated, subjected to pulse field electrophoresis to remove unintegrated intermediates, and analyzed by IPDA. (b) IPDA analysis of high molecular weight DNA from sorted cells. Droplets in Q1 and Q4 largely reflect the shearing of intact proviruses (DSI = 0.46) during in DNA isolation and purification. (c) Frequency of intact proviruses in GFP and GFP+ cells before and after correction for shearing. After correction for shearing, the frequency of intact proviruses in sorted GFP+ cells is close to the expected value of 1. (d) Map of the HIV-1 genome in GFP-expressing HIV-1 vector R7-GFP used in (a). GFP is inserted in the nef ORF. Positions of outer primers in the LTR and GFP used in single genome amplifications are indicated. (e) Sequence analysis of 9 independent single genomes. Arrows indicated positions of the Ψ and env IPDA amplicons. Orange lines indicate intact sequence without deletions or hypermutation and identical to R7-GFP except for single base mutations (black lines).
Extended Data Fig. 7.
DNA shearing index (DSI) for patient samples (n=62). The DSI was determined by ddPCR using two amplions in a cellular gene (RPP30) spaced at exactly the same distance as the Ψ and env amplicons. It is the fraction of templates in which DNA shearing has occurred between the amplicons. Horizontal bars indicate media and interquartile range.
Extended Data Fig. 8.
In vivo decay rates of cells with intact and defective proviruses. The frequency of cells carrying intact proviruses, proviruses with 3′ deletion and/or hypermutation (3′ del/hyper), and proviruses with 5′ deletions (5′ del) was measured in resting CD4+ T-cells from patients on long term suppressive ART. Data are plotted in terms of decay rate assuming exponential decay. Half-life values for the same decay curves are sown in Fig. 4c. Negative decay rate indicates proliferation.
Extended Data Fig. 9.
Variability in decay slopes. Mean and standard deviation of the decay slopes for intact and defective proviruses in infected individuals on ART sampled longitudinally (n=14). Based on decay data in Fig. 4a.
Fig. 1.
Fig. 1.
DNA PCR assays predominantly measure defective proviruses. (a) Proviruses persisting in CD4+ T-cells of individuals on suppressive ART as detected by nFGS,. Defects include internal stop codons, deletions not attributable to normal length polymorphisms, and APOBEC3G/F-mediated hypermutation (G→A). Most deletions were large except for those in the packaging signal (ψ)/major splice donor site. Based on 211 sequences from individuals initiating ART during chronic infection. (b) Fraction of defective proviruses with defects in the indicated genes or elements. Protein-coding genes were considered defective if any of the following are present: mutated start codon, internal stop codons, frameshifts, or insertions or deletions not representing common length polymorphisms. Splice site mutations further increased the fraction of defective sequences (lighter shaded portions of the bars for spliced genes). LTR sequences were considered defective if mutations in the NFκB sites and/or deletions were present. See Table S1 for details. (c) Positions of amplicons used in standard DNA and Alu-PCR assays. See Table S2 for coordinates and references. Numbers distinguish distinct assays targeting the same region. Alu PCR assays also amplify host genomic sequence (arrows). (d) Conservation of sequence across the genome based on a US clade B sequences in the Los Alamos HIV Sequence Database (https://www.hiv.lanl.gov/). Plotted as % of sequences matching the consensus at each nucleotide. (e) Position of internal deletions across the HIV-1 genome. Plotted as % of total sequences from treated patients deleted at the indicated nucleotide. (f) Percent of all proviruses that are amplified by the indicated assay. Based on absence of overlap between deleted regions and the relevant amplicons. (g) Percent of the proviruses detected by the indicated assay that are intact. (h) Percent loss of assay signal following a selective 10-fold reduction in intact proviruses. For panels f-h, analysis is based 211 sequences from 19 patients starting ART during chronic infection.
Fig. 2.
Fig. 2.
Distinguishing intact and defective HIV-1 proviruses. (a) Sliding window analysis of optimal amplicon positioning to detect deletions. Optimal discrimination between intact and deleted sequences is obtained with a 5′ amplicon in the Ψ region and a 3′ amplicon in env. Ψ is the site of frequent small deletions and is included in larger 5′ deletions. Based on 431 independent near full genome sequences in the database including 258 that contain mapped deletions. Inclusion of an additional 474 sequences from treated patients did not change optimal positions. (b) Nucleotide conservation across the env gene based on US clade B sequences in the Los Alamos HIV Sequence Database, is plotted as percent of sequences matching the consensus sequence at each nucleotide. Shaded area is expanded in Fig. 2d. (c) GG→AG hypermutation across the env gene. The percent of hypermutated proviruses that contain one or more G→A mutations within a given APOBEC3G consensus site is plotted as a function of site position. Shaded area is expanded in Fig. 2e. (d) Sequence conservation of a region in the RRE containing two APOBEC3G consensus sites. Primer (arrows) and probe (box) positions for the env amplicon are shown. (e) Fraction of hypermutated proviruses with G→A mutations in the probe binding region (shaded). (f) Hypermutation patterns at the env probe binding site. The prevalence of 13 observed patterns is indicated in the bar graph on the left and in the “Percent” column. Mutations in the APOBEC3G consensus sites (underlined) are indicated in red. Based 93 independent hypermutated env sequences from 18 treated patients. Site directed mutagenesis was used to modify NL4–3 or a patient-derived proviral construct to generate plasmids containing each pattern. The “Amplified” column indicates that only 5% of hypermutated sequences were amplified by the probe combinations developed to identify intact sequences.
Fig. 3.
Fig. 3.
Intact proviral DNA assay (IPDA). (a) Assay schematic. Multiplex PCRs in droplets amplify Ψ and env regions. A separate multiplex PCR targets two regions of the human RPP30 gene spaced at the same distance as the Ψ and env amplicons to provide cell number quantitation and DNA shearing correction. See Methods for details. (b) Representative control ddPCR experiment using proviral constructs with a 5’ deletion (E44E11), a 3’ deletion (4F11), or no defects (NL4–3). 1,000 copies each were mixed with 500 ng of HIV-1 negative DNA to simulate a patient sample. Types of proviruses appearing in different quadrants are shown on the right. (c) Representative IPDA results from a patient CD4+ T-cell sample. Boxed areas are expanded to show individual positive droplets. (d) DNA shearing index (DSI, fraction of templates sheared between targeted regions) measured for RPP30 and HIV-1 on JLat DNA samples subjected to different levels of shearing (n=22). Compared using two tailed t-test for paired non parametric values. (e) Use of DSI to correct raw ddPCR output for RPP30 and HIV. Mean and SD of copies/cell of RPP30 (blue) and HIV (orange) are shown before (circles) and after (triangles) correction for shearing. (f) IDPA results on CD4+ T-cells from infected individuals (n=62) with plasma HIV-1 RNA below the limit of detection. Bars indicate geometric mean ± SEM. See Table S3 for patient characteristics. Polymorphisms precluding amplification with either primer/probe set were not observed in this cohort and would require triage primer/probe sets incorporating rare polymorphisms. (g) Correlation between infected cell frequencies measured by QVOA and IPDA on the same samples of CD4+ T-cells from treated patients (n=36). IUPM, infectious units per million cells. (h) IPDA/QVOA ratios for samples from Fig. 3g. Horizintal bars indicate geometric mean and 95% CI. (i) Bioinformatic comparison of standard gag PCR and IPDA with respect to % of proviruses amplified, % of defective proviruses excluded, % of amplified proviruses that are intact, and % loss in assay signal following a selective 10-fold reduction in intact proviruses. See legend to Fig. 1f-h for details.
Fig. 4.
Fig. 4.
IPDA reveals differential dynamics of intact and defective proviruses. (a) Decay of intact proviruses, proviruses with 3′ deletion and/or hypermutation (3′ del/hyper), and proviruses with 5′ deletions (5′ del) measured in resting CD4+ T cells from patients on long term ART. (b) Half-lives of cells carrying intact proviruses assuming exponential decay, from the data in (a). (c) Half-lives of populations of cells carrying intact and defective proviruses. Increasing frequencies are plotted as doubling times. (d) Distribution of intact and defective proviruses in memory CD4+ T-cell subsets. (e) System for examining the proliferation of infected cell clones. Total proviruses in resting CD4+ T-cells from patients on ART were measured using a standard gag PCR corrected for gag-deleted proviruses. Cells were diluted to ~1 infected cell/well (2000–4000 total resting CD4+ T cells/well) and stimulated 2–4 times with anti-CD3+anti-CD28 microbeads in the presence of IL-2 and antiretroviral drugs (see Methods) resulting in expansion to an average of 2×10⁶ cells/well. DNA was isolated for IPDA and for integration site analysis and nFGS, performed as previously described,. (f) IPDA and integration site analysis of 1731 microcultures from 5 patients. Y-axis indicated number of proviruses in each positive culture. Colors indicate type of provirus detected. Bars indicate geometric mean of proviruses/culture for each provirus type. Statistical significance of differences was determined by Welch’s t-test. Integration sites for some clones with the highest proliferation are indicated in blue boxes. Pie charts indicate the fractions of integration sites in transcriptional units, intergenic regions, or with cancer associations for cultures with high (> 20 proviruses, top) or low (< 20 proviruses, bottom) proliferation. (g) nFGS results for cultures showing proliferation. Sequences were analyzed for defects affecting expression of each HIV-1 gene as described in Fig. 1b. Count indicates proviruses/culture as detected by IPDA.

References

    1. Finzi D et al. Identification of a reservoir for HIV-1 in patients on highly active antiretroviral therapy. Science 278, 1295–1300 (1997). - PubMed
    1. Chun TW et al. Presence of an inducible HIV-1 latent reservoir during highly active antiretroviral therapy. Proc. Natl. Acad. Sci. U. S. A 94, 13193–13197 (1997). - PMC - PubMed
    1. Wong JK et al. Recovery of replication-competent HIV despite prolonged suppression of plasma viremia. Science 278, 1291–1295 (1997). - PubMed
    1. Archin NM et al. Administration of vorinostat disrupts HIV-1 latency in patients on antiretroviral therapy. Nature 487, 482–485 (2012). - PMC - PubMed
    1. Borducchi EN et al. Ad26/MVA therapeutic vaccination with TLR7 stimulation in SIV-infected rhesus monkeys. Nature 540, 284–287 (2016). - PMC - PubMed

Additonal References for Methods Section

    1. Berry CC et al. Estimating abundances of retroviral insertion sites from DNA fragment length data. Bioinformatics 28, 755–762 (2012). - PMC - PubMed
    1. Detels R et al. The multicenter AIDS Cohort Study, 1983 to … Public Health 126, 196–198 (2012). - PMC - PubMed
    1. Rose PP & Korber BT Detecting hypermutations in viral sequences with an emphasis on G --> A hypermutation. Bioinformatics 16, 400–401 (2000). - PubMed
    1. Laird GM, Rosenbloom DI, Lai J, Siliciano RF & Siliciano JD Measuring the Frequency of Latent HIV-1 in Resting CD4(+) T Cells Using a Limiting Dilution Coculture Assay. Methods Mol. Biol 1354, 239–253 (2016). - PubMed
    1. Laird GM et al. Rapid quantification of the latent reservoir for HIV-1 using a viral outgrowth assay. PLoS Pathog. 9, e1003398 (2013). - PMC - PubMed

Publication types

MeSH terms