

Interplay between post-translational cyclooxygenase-2 modifications and the metabolic and proteomic profile in a colorectal cancer cohort
- PMID: 30700940
- PMCID: PMC6350170
- DOI: 10.3748/wjg.v25.i4.433
Interplay between post-translational cyclooxygenase-2 modifications and the metabolic and proteomic profile in a colorectal cancer cohort
Abstract
Background: Colorectal cancer (CRC) is the second most common cause of cancer death worldwide. It is broadly described that cyclooxygenase-2 (COX-2) is mainly overexpressed in CRC but less is known regarding post-translational modifications of this enzyme that may regulate its activity, intracellular localization and stability. Since metabolic and proteomic profile analysis is essential for cancer prognosis and diagnosis, our hypothesis is that the analysis of correlations between these specific parameters and COX-2 state in tumors of a high number of CRC patients could be useful for the understanding of the basis of this cancer in humans.
Aim: To analyze COX-2 regulation in colorectal cancer and to perform a detailed analysis of their metabolic and proteomic profile.
Methods: Biopsies from both healthy and pathological colorectal tissues were taken under informed consent from patients during standard colonoscopy procedure in the University Hospital of Bellvitge (Barcelona, Spain) and Germans Trias i Pujol University Hospital (Campus Can Ruti) (Barcelona, Spain). Western blot analysis was used to determine COX-2 levels. Deglycosylation assays were performed in both cells and tumor samples incubating each sample with peptide N-glycosidase F (PNGase F). Prostaglandin E2 (PGE2) levels were determined using a specific ELISA. 1H high resolution magic angle spinning (HRMAS) analysis was performed using a Bruker AVIII 500 MHz spectrometer and proteomic analysis was performed in a nano-liquid chromatography-tandem mass spectrometer (nano LC-MS/MS) using a QExactive HF orbitrap MS.
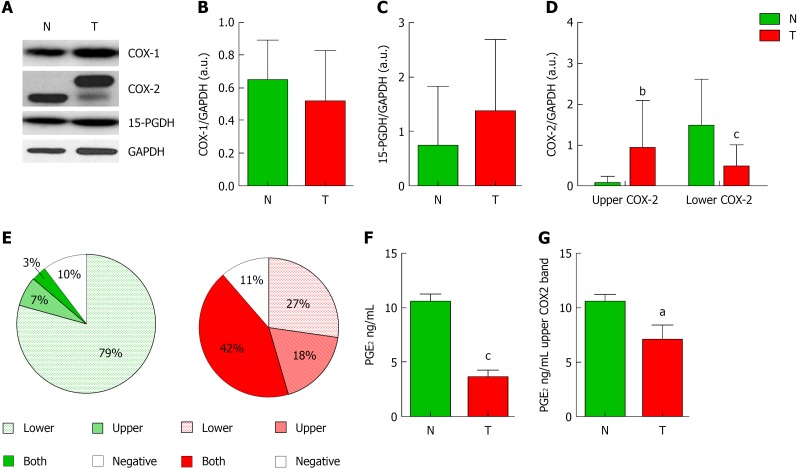
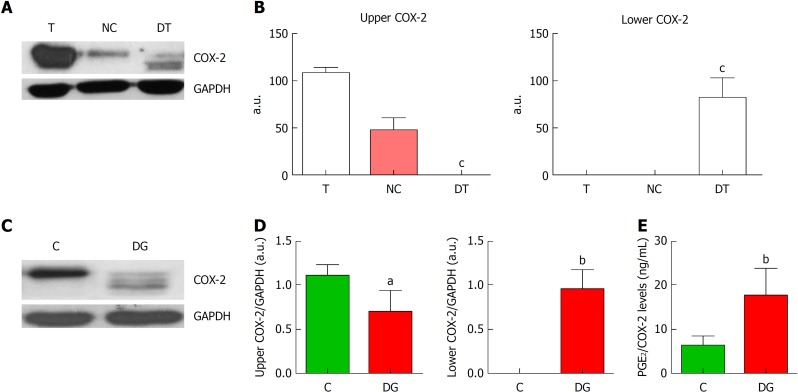
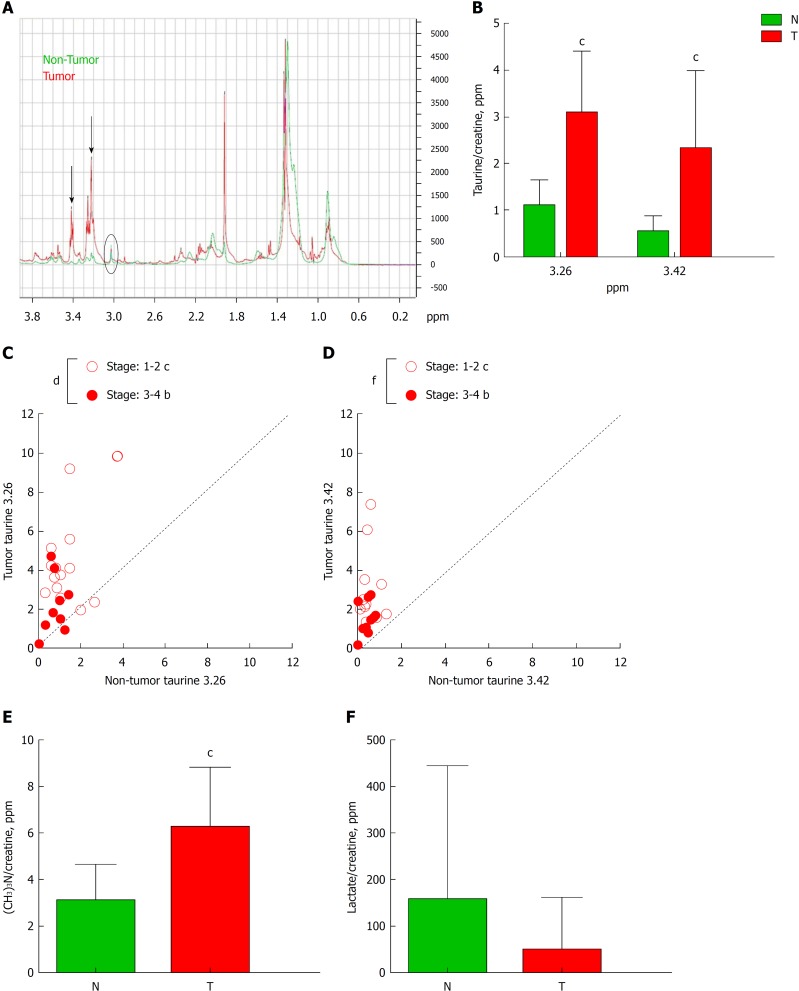
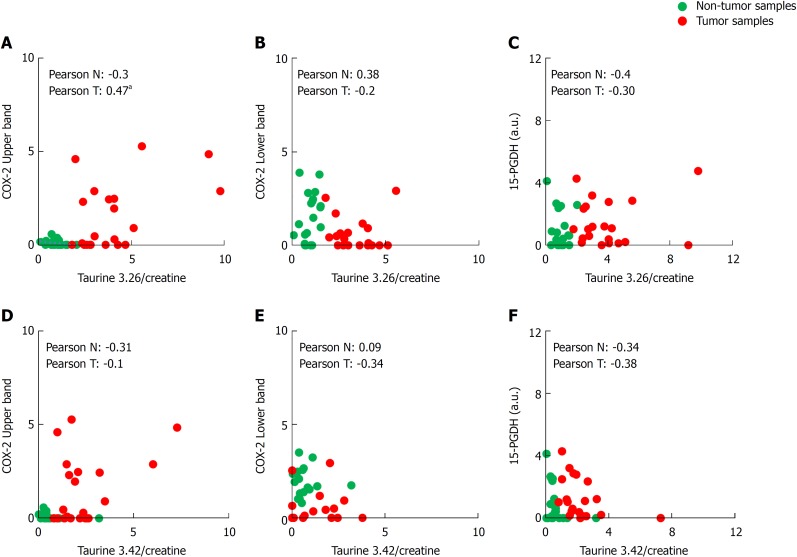
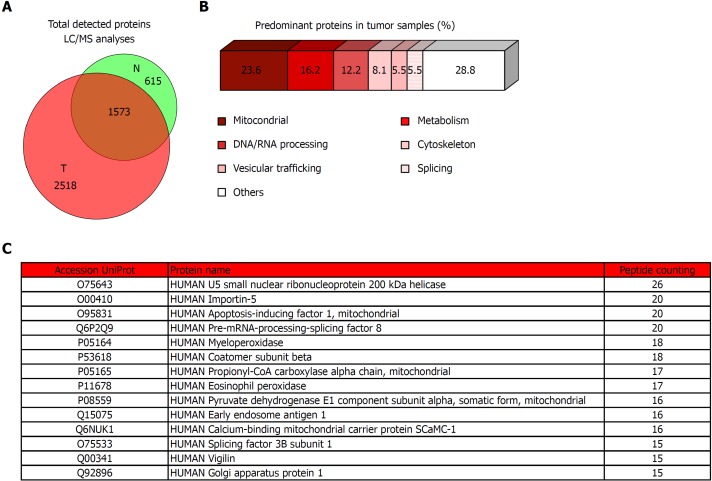
Results: Our data show that COX-2 has a differential expression profile in tumor tissue of CRC patients vs the adjacent non-tumor area, which correspond to a glycosylated and less active state of the protein. This fact was associated to a lesser PGE2 production in tumors. These results were corroborated in vitro performing deglycosylation assays in HT29 cell line where COX-2 protein profile was modified after PNGase F incubation, showing higher PGE2 levels. Moreover, HRMAS analysis indicated that tumor tissue has altered metabolic features vs non-tumor counterparts, presenting increased levels of certain metabolites such as taurine and phosphocholine and lower levels of lactate. In proteomic experiments, we detected an enlarged number of proteins in tumors that are mainly implicated in basic biological functions like mitochondrial activity, DNA/RNA processing, vesicular trafficking, metabolism, cytoskeleton and splicing.
Conclusion: In our colorectal cancer cohort, tumor tissue presents a differential COX-2 expression pattern with lower enzymatic activity that can be related to an altered metabolic and proteomic profile.
Keywords: Carcinoma; Colon; Cyclooxygenase; High resolution magic angle spinning; Prostaglandin; Proteomics.
Conflict of interest statement
Conflict-of-interest statement: MAP is cofounder and equity holder of Aniling, a biotech company with no interests in this work. MAP lab has received research funding from Celgene. The rest of the authors declare no conflict of interest.
Figures
Similar articles
-
Proteomic analysis of minute amount of colonic biopsies by enteroscopy sampling.Biochem Biophys Res Commun. 2016 Aug 5;476(4):286-292. doi: 10.1016/j.bbrc.2016.05.114. Epub 2016 May 24. Biochem Biophys Res Commun. 2016. PMID: 27230957
-
The role of cyclooxygenase-2 in mediating the effects of histamine on cell proliferation and vascular endothelial growth factor production in colorectal cancer.Clin Cancer Res. 2005 Oct 1;11(19 Pt 1):6807-15. doi: 10.1158/1078-0432.CCR-05-0675. Clin Cancer Res. 2005. PMID: 16203768
-
Revelation of Proteomic Indicators for Colorectal Cancer in Initial Stages of Development.Molecules. 2020 Jan 31;25(3):619. doi: 10.3390/molecules25030619. Molecules. 2020. PMID: 32023884 Free PMC article.
-
Probing the colorectal cancer proteome for biomarkers: Current status and perspectives.J Proteomics. 2018 Sep 15;187:93-105. doi: 10.1016/j.jprot.2018.06.014. Epub 2018 Jun 25. J Proteomics. 2018. PMID: 29953962 Review.
-
The Role of Cyclooxygenase-2 in Colorectal Cancer.Int J Med Sci. 2020 Apr 27;17(8):1095-1101. doi: 10.7150/ijms.44439. eCollection 2020. Int J Med Sci. 2020. PMID: 32410839 Free PMC article. Review.
Cited by
-
Proteomic and molecular dynamic investigations of PTM-induced structural fluctuations in breast and ovarian cancer.Sci Rep. 2021 Sep 29;11(1):19318. doi: 10.1038/s41598-021-98201-7. Sci Rep. 2021. PMID: 34588485 Free PMC article.
-
Crosstalk between P2Y receptors and cyclooxygenase activity in inflammation and tissue repair.Purinergic Signal. 2024 Apr;20(2):145-155. doi: 10.1007/s11302-023-09938-x. Epub 2023 Apr 13. Purinergic Signal. 2024. PMID: 37052777 Free PMC article. Review.
-
Metabolism pathways of arachidonic acids: mechanisms and potential therapeutic targets.Signal Transduct Target Ther. 2021 Feb 26;6(1):94. doi: 10.1038/s41392-020-00443-w. Signal Transduct Target Ther. 2021. PMID: 33637672 Free PMC article. Review.
-
NOD1 deficiency promotes an imbalance of thyroid hormones and microbiota homeostasis in mice fed high fat diet.Sci Rep. 2020 Jul 23;10(1):12317. doi: 10.1038/s41598-020-69295-2. Sci Rep. 2020. PMID: 32704052 Free PMC article.
-
Limited Proteolysis of Cyclooxygenase-2 Enhances Cell Proliferation.Int J Mol Sci. 2020 Apr 30;21(9):3195. doi: 10.3390/ijms21093195. Int J Mol Sci. 2020. PMID: 32366045 Free PMC article.
References
-
- Ferrández A, Prescott S, Burt RW. COX-2 and colorectal cancer. Curr Pharm Des. 2003;9:2229–2251. - PubMed
MeSH terms
Substances
LinkOut - more resources
Full Text Sources
Medical
Research Materials
Miscellaneous
