. 2019 Jan 16:9:2990.
doi: 10.3389/fimmu.2018.02990. eCollection 2018.

CD8+XCR1neg Dendritic Cells Express High Levels of Toll-Like Receptor 5 and a Unique Complement of Endocytic Receptors

Affiliations

CD8+XCR1neg Dendritic Cells Express High Levels of Toll-Like Receptor 5 and a Unique Complement of Endocytic Receptors

Ben Wylie et al. Front Immunol. .

Abstract

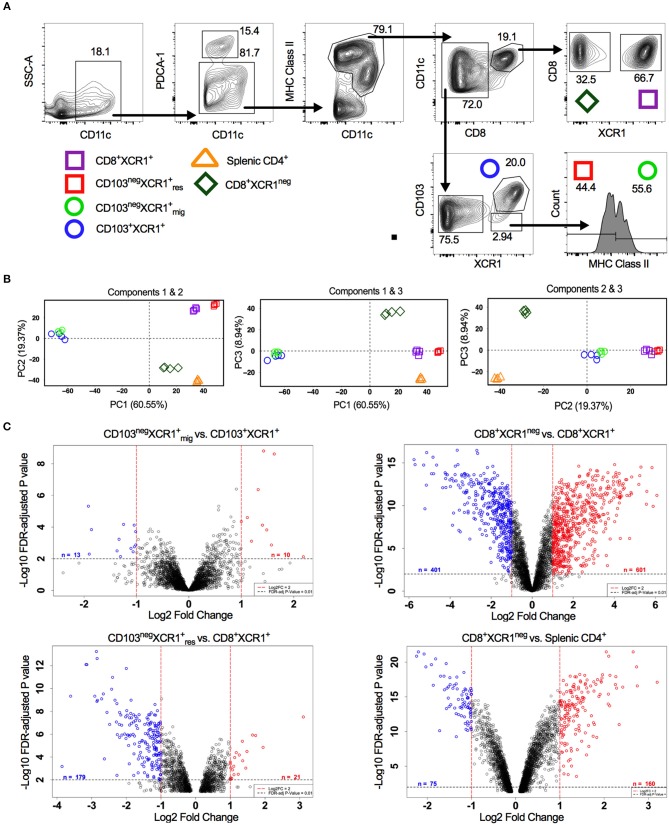
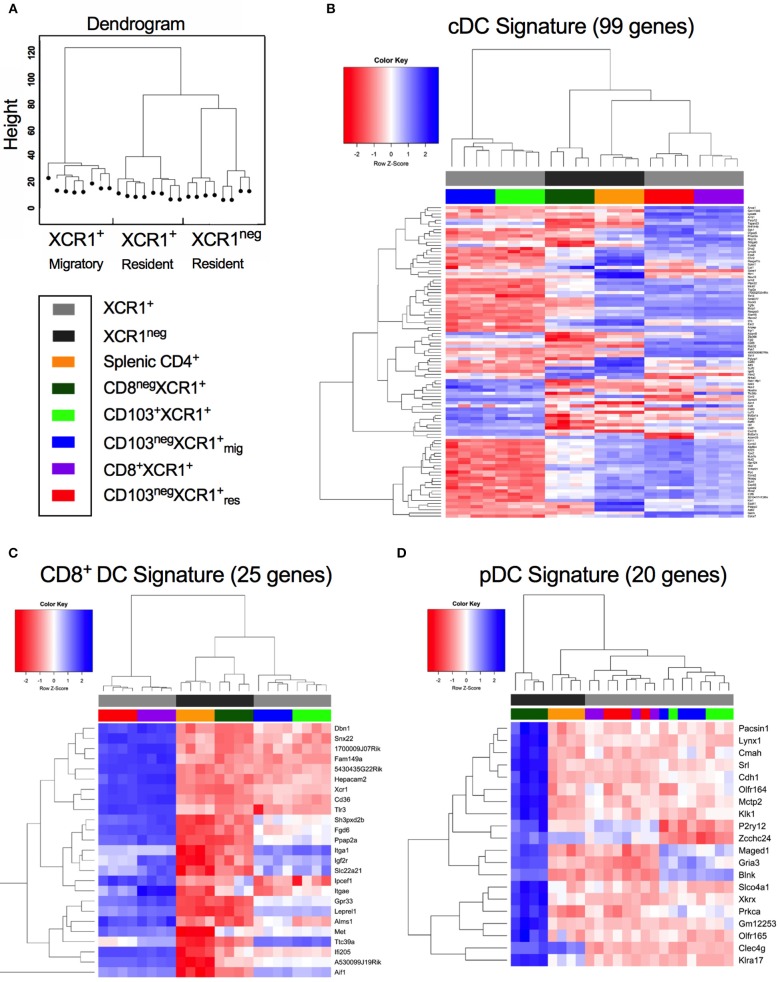
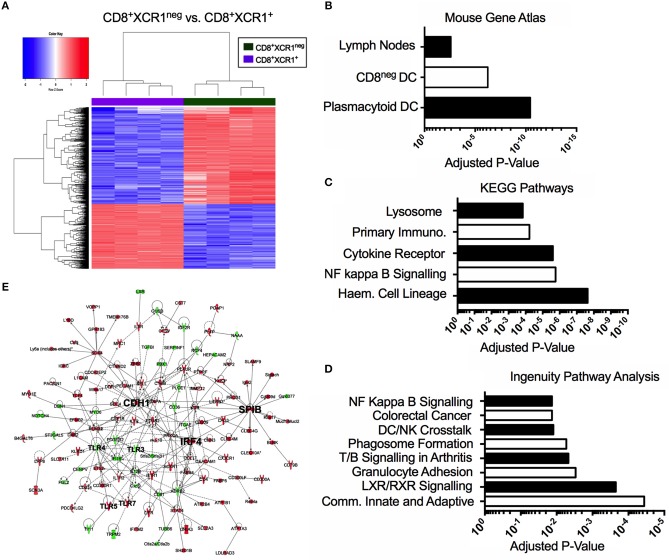
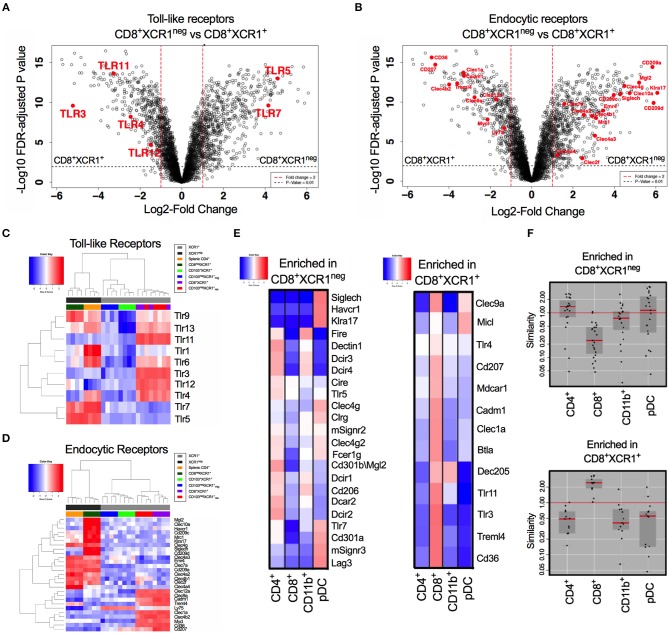
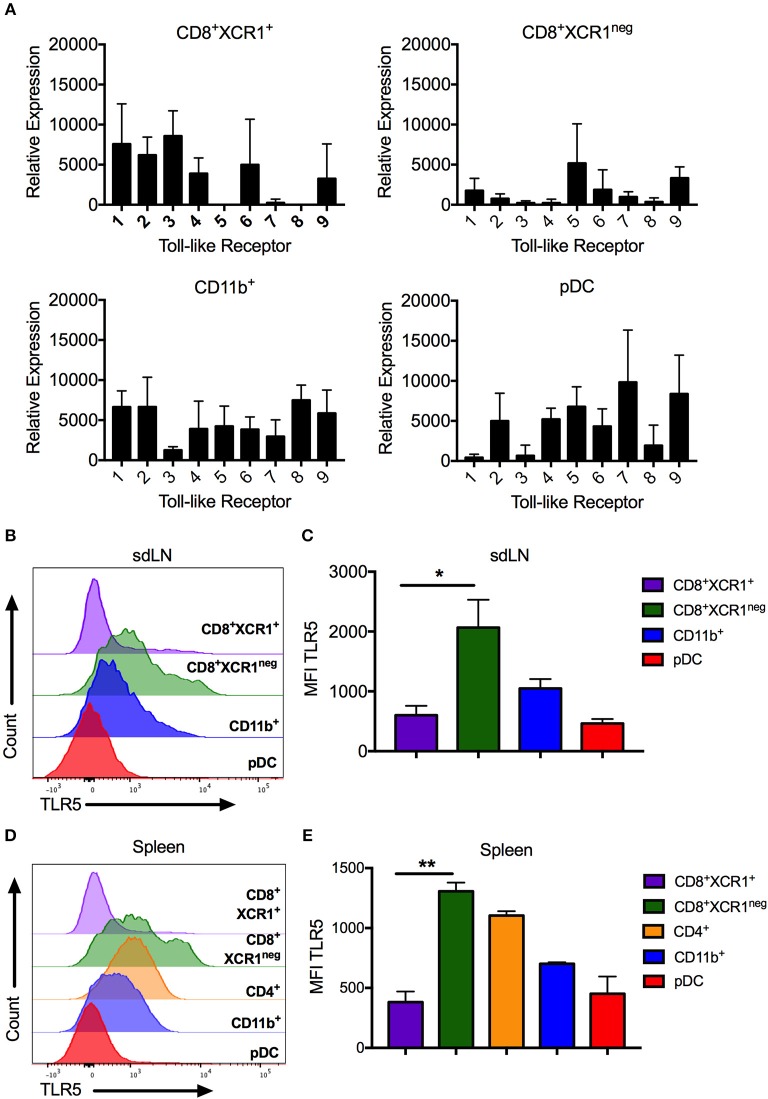
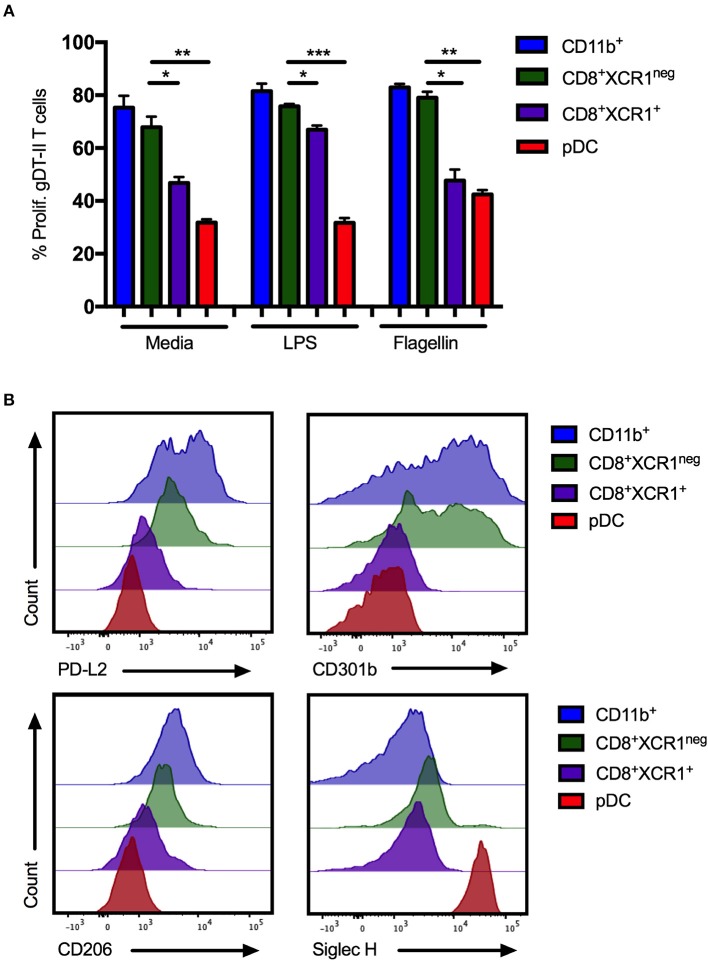
Conventional dendritic cells (cDC) resident in the lymphoid organs of mice have been classically divided into CD8+ and CD8neg subsets. It is well-established that CD8+ dendritic cells (DCs) and their migratory counterparts in the periphery comprise the cross-presenting cDC1 subset. In contrast, CD8neg DCs are grouped together in the heterogeneous cDC2 subset. CD8neg DCs are relatively poor cross-presenters and drive more prominent CD4+ T cell responses against exogenous antigens. The discovery of the X-C motif chemokine receptor 1 (XCR1) as a specific marker of cross-presenting DCs, has led to the identification of a divergent subset of CD8+ DCs that lacks the ability to cross-present. Here, we report that these poorly characterized CD8+XCR1neg DCs have a gene expression profile that is consistent with both plasmacytoid DCs (pDCs) and cDC2. Our data demonstrate that CD8+XCR1neg DCs possess a unique pattern of endocytic receptors and a restricted toll-like receptor (TLR) profile that is particularly enriched for TLR5, giving them a unique position within the DC immunosurveillance network.

Keywords: TLR5; XCR1; dendritic cells; immunosurveillance; microarray; transcriptomics.


Figures

Figure 1
Figure 1
Analysis of DC subset relatedness in the skin-draining lymph nodes reveals differences in gene expression profiles of CD8+XCR1neg and CD8+ XCR1+ DCs. (A) Gating strategy used to identify and sort dendritic cell subsets for microarray analysis. (B) RNA was extracted from sorted DC subsets and analyzed with the Affymetrix Mouse Gene 2.0 ST array. Principle component analysis of the first three components. CD8+XCR1neg subset (diamond), XCR1+ resident subsets (squares), XCR1+ migratory subsets (circles) and splenic CD4+ subset (triangle). (C) Volcano plots displaying differential gene expression between related migratory and resident DC subsets. Red dashes represent log2FC>1 and black dashes represent adjusted P-value <0.01. Numbers of differentially expressed genes are indicated on each plot. Red labeled genes are up-regulated and blue labeled genes are down-regulated relative to the population indicated first in the title.
Figure 2
Figure 2
CD8+XCR1neg DCs display up-regulated expression of a gene set associated with pDCs but not conventional or CD8+ DCs. Gene expression data from microarray analysis of sorted DC subsets were compared to previously reported gene signatures for conventional DCs (cDC), CD8-specific (CD8+ DC) DCs and pDCs (pDC) (27). (A) Dendrogram displaying hierarchical clustering of individual sorted DC populations divided into XCR1+ migratory, XCR1+ resident and XCR1neg resident. (B) Differential expression of a panel of 99 cDC signature genes from microarray data of sorted DC subsets. (C) Differential expression of a panel of 25 CD8+ DC signature genes from microarray data of sorted DC subsets. (D) Differential expression of a panel of 20 pDC signature genes from microarray data of sorted DC subsets. Red; upregulated, Blue; down-regulated. Populations have been clustered hierarchically, dark gray bars represent XCR1neg populations while light gray bars represent XCR1+ populations. Heatmaps are colored coded according to the legend.
Figure 3
Figure 3
The CD8+XCR1neg DCs transcriptome is related to both pDCs and CD8neg DCs and is enriched for TLR and NF-kappa B signaling pathways. Bioinformatics tools were used to interrogate the differential gene expression observed between CD8+XCR1neg and CD8+XCR1+ DCs. (A) Heatmap shows differential gene expression between CD8+XCR1neg and CD8+XCR1+ DCs. Red; up-regulated (n = 601), Blue; down-regulated (n = 401) in CD8+XCR1neg population. Genes upregulated in CD8+XCR1neg DCs with a FC >2 and adj. p-value < 0.01 were analyzed using the Enrichr online platform and queried against: (B) The Mouse Genome Atlas database. Significant results (p < 0.05) are shown. (C) The KEGG pathways database. The top 5 enriched pathways are shown. (D) Highly differentially expressed genes (FC >5) were analyzed using IPA to identify enriched pathways and over-represented gene sets. The top 8 pathways are shown. (E) IPA network analysis was conducted in IPA to construct a network of differentially expressed genes (FC >5). Hub genes and important signaling molecule, such as TLRs, are labeled in bold. Red; upregulated in CD8+XCR1neg, Green; up-regulated in CD8+XCR1+. Full data tables for each analysis are provided in the Supplementary Data. Immuno, Immunodeficency; Haem, Haemopoietic.
Figure 4
Figure 4
Differential expression of TLRs and endocytic receptors between CD8+XCR1neg and CD8+XCR1+ DCs. The expression of TLRs and endocytic receptors was compared between CD8+XCR1neg and CD8+XCR1+ DCs. Volcano plots show differential between CD8+XCR1neg and CD8+XCR1+ DCs. Red dashed line represents log2FC>1 and black dashed line represents adjusted p-value < 0.01. TLRs (A) and endocytic receptors (B) are highlighted in red. Heatmaps of gene expression comparing expression of TLRs 1-13 (C) and endocytic receptors (D) across the DC subsets in the microarray. (E) TLRs and CLRs enriched in either CD8+XCR1neg or CD8+XCR1+ DCs were compared to expression profiles of known DC subsets from the Immgen database using online tools. Red; up-regulated, Blue; down-regulated. (F) W-Plots summarize the relatedness of TLR and CLR profiles for CD8+XCR1neg and CD8+XCR1+ DCs obtained from microarray data to specific Immgen populations.
Figure 5
Figure 5
CD8+XCR1neg DCs can be differentiated from CD8+XCR1+ DCs by TLR5 mRNA and cell surface expression. DC subsets were isolated from the sdLN and spleen and their TLR expression was analyzed by RT-PCR or flow cytometry (A) RT-PCR analysis of DC subsets sorted from the sdLNs (Supplementary Figure 1A) and converted to cDNA for use as template in RT-PCR reactions with primers specific to TLRs 1-9. Data are presented as relative expression normalized to GAPDH, n = 3 and error bars represent SEM. DC subsets were isolated from sdLN (B,C) or spleen (D,E) and analyzed by flow cytometry for TLR5 expression. Representative histograms of 4 independent experiments are shown for sdLN (B) and spleen (D). MFI of TLR5 expression on DC subsets from the sdLN (C) or spleen (E) presented as the mean ± the SEM. *p < 0.05, **p < 0.01, n = 4.
Figure 6
Figure 6
CD8+XCR1neg DCs do not produce Type I IFNs after stimulation with the TLR5 agonist flagellin. DC subsets sorted from the spleens of naïve C57BL/6 mice (Supplementary Figure 1B) were cultured overnight in the presence of TLR agonists Flagellin (Flag.) (100ng/uL), CpG (1 μg/mL) or in media alone at a concentration of 30,000–100,000 DCs/well. After 24 h supernatants were collected, acid treated, serially diluted onto L929 cells and incubated overnight prior to addition of EMCV. After 2 days cells were stained with crystal violet, washed and absorbance was measured at 595 nM. Bioactive IFN production was measured as protection from viral killing compared to no virus control wells. Data are presented as the mean ± SEM of three independent experiments, n = 6. ** represents p < 0.01 and * represent p < 0.05 vs. unstimulated pDC control well. 100 k = 100,000 DC/well, 30 k = 30,000 DC/well.
Figure 7
Figure 7
CD8+XCR1neg DCs resemble cDC2 DCs in MHC class II presentation ability and CLR expression in the sdLN. sdLN DCs were sorted as in Supplementary Figure 1A. (A) DC subsets were activated for 24 h in vitro with TLR agonists LPS (100 ng/mL) or Flagellin (1 μg/mL) or left unstimulated. Activated DCs were pulsed with 1 nM gD peptide for 1 h and cultured for 4 days with naïve CFSE-labeled gDT-II at a 1:10 ratio. Proliferation of gDT-II cells was measured by CFSE dilution. Data are presented as the percentage of CFSE low (proliferated) gDT-II cells and error bars show mean ± SEM from two independent experiments, n = 4, *p > 0.05, **p > 0.01, ***p > 0.001. (B) Expression of PD-L2 and CLRs, CD206, CD301b, and Siglec-H on DC subsets isolated from sdLNs of naïve C57Bl/6 mice. Representative plots of 3 independent experiments are shown.

Similar articles

Cited by

References

    1. Banchereau J, Steinman RM. Dendritic cells and the control of immunity. Nature (1998) 392:245–52. 10.1038/32588 - DOI - PubMed
    1. Pulendran B, Tang H, Denning TL. Division of labor, plasticity, and crosstalk between dendritic cell subsets. Curr Opin Immunol. (2008) 20:61–7. 10.1016/j.coi.2007.10.009 - DOI - PMC - PubMed
    1. Dudziak D, Kamphorst AO, Heidkamp GF, Buchholz VR, Trumpfheller C, Yamazaki S, et al. . Differential antigen processing by dendritic cell subsets in vivo. Science (2007) 315:107–10. 10.1126/science.1136080 - DOI - PubMed
    1. Edelson BT, KC W, Juang R, Kohyama M, Benoit LA, Klekotka PA, et al. . Peripheral CD103+; dendritic cells form a unified subset developmentally related to CD8α+ conventional dendritic cells. J Exp Med. (2010) 207:823–36. 10.1084/jem.20091627 - DOI - PMC - PubMed
    1. Den Haan JM, Lehar SM, Bevan MJ. CD8(+) but not CD8(-) dendritic cells cross-prime cytotoxic T cells in vivo. J Exp Med. (2000) 192:1685–96. 10.1084/jem.192.12.1685 - DOI - PMC - PubMed

Publication types