. 2019 Jan 28:5:60.
doi: 10.1038/s41420-019-0139-9. eCollection 2019.

The palladacycle complex AJ-5 induces apoptotic cell death while reducing autophagic flux in rhabdomyosarcoma cells

Affiliations

The palladacycle complex AJ-5 induces apoptotic cell death while reducing autophagic flux in rhabdomyosarcoma cells

Jenna Susan Bleloch et al. Cell Death Discov. .

Abstract

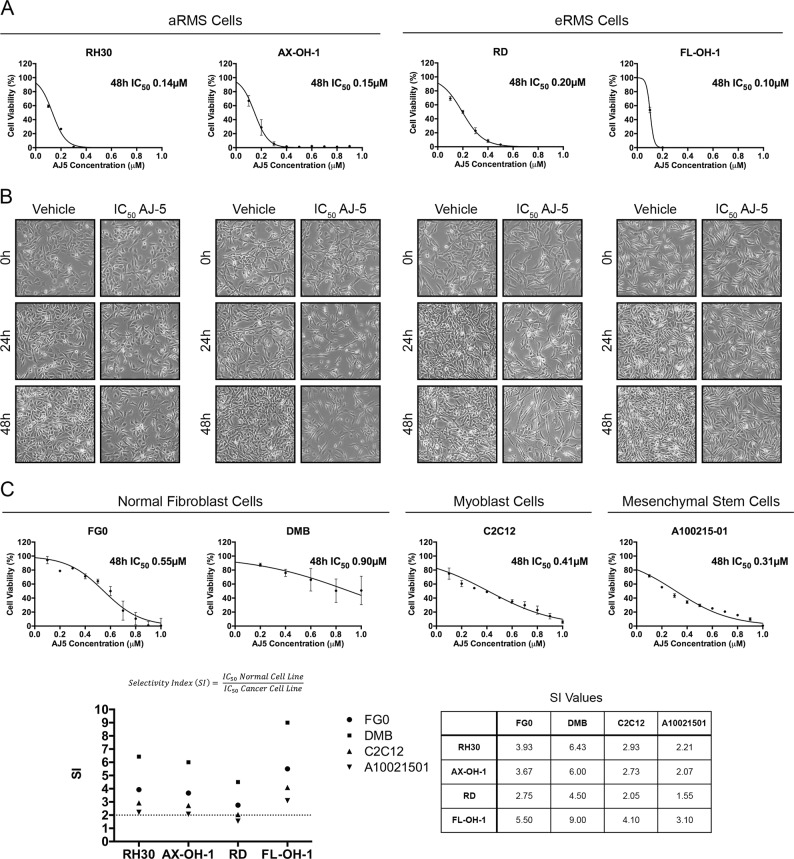
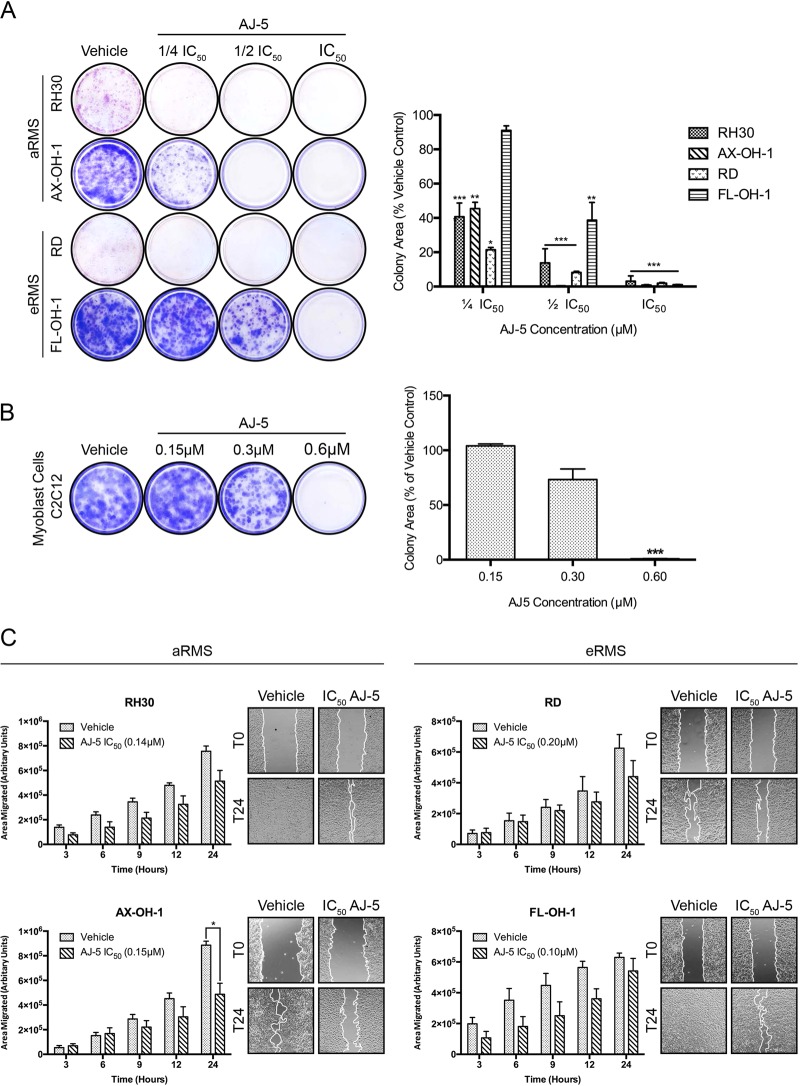
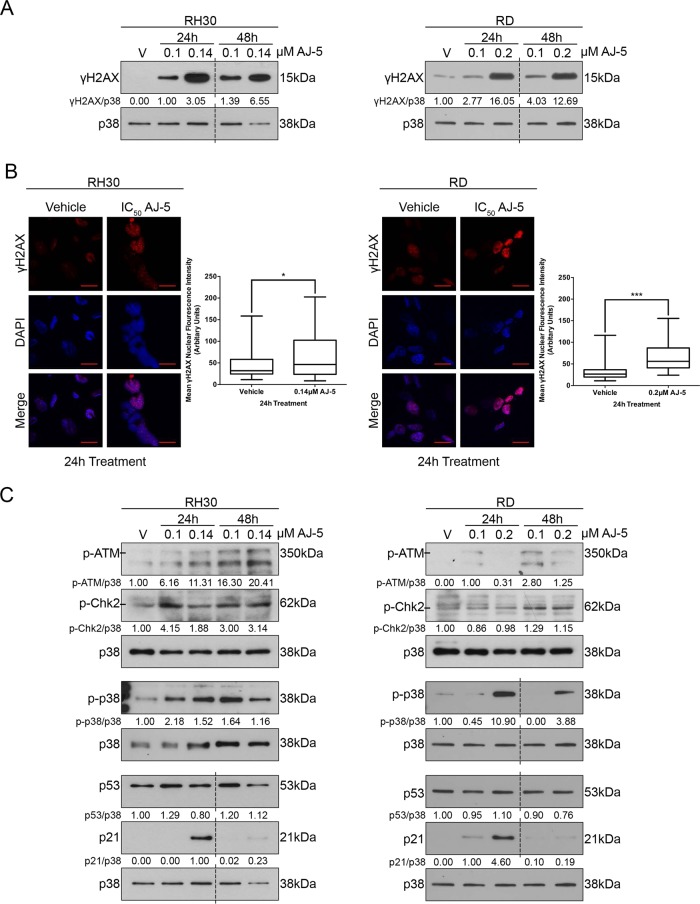
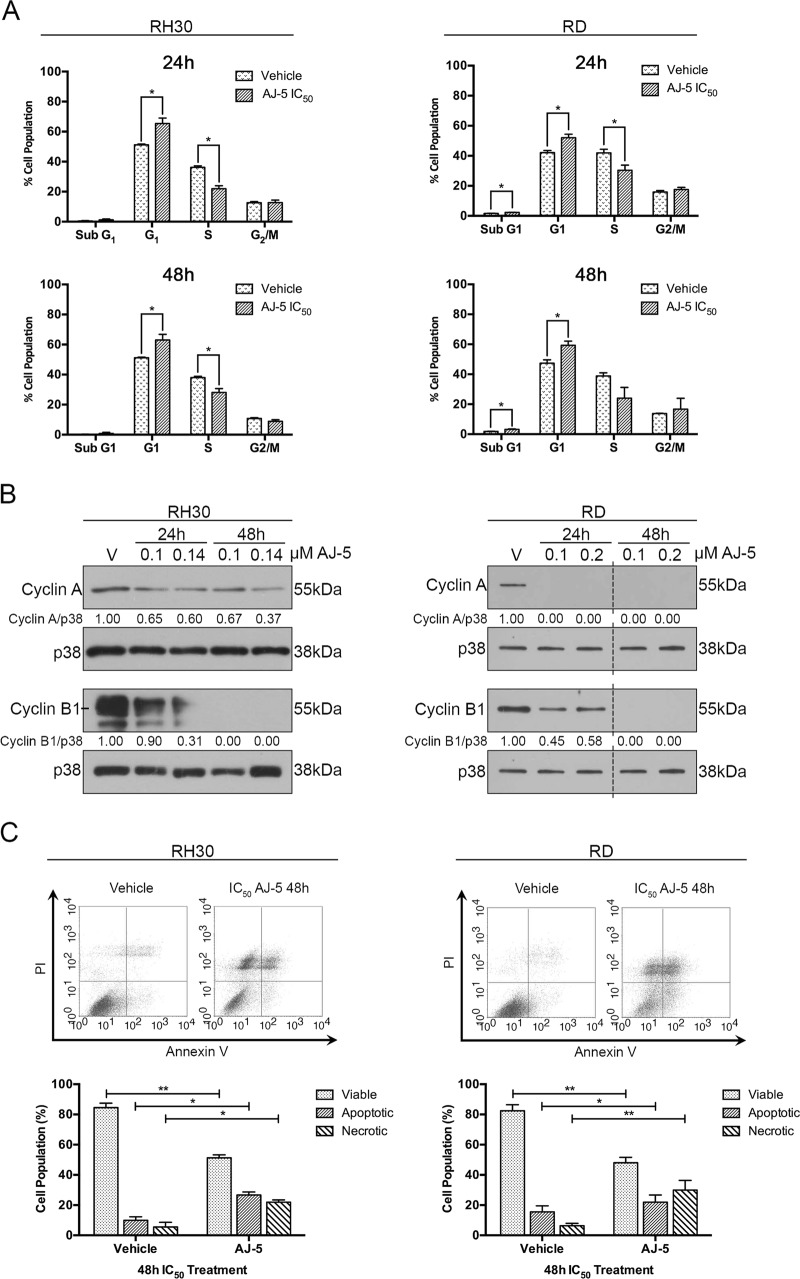
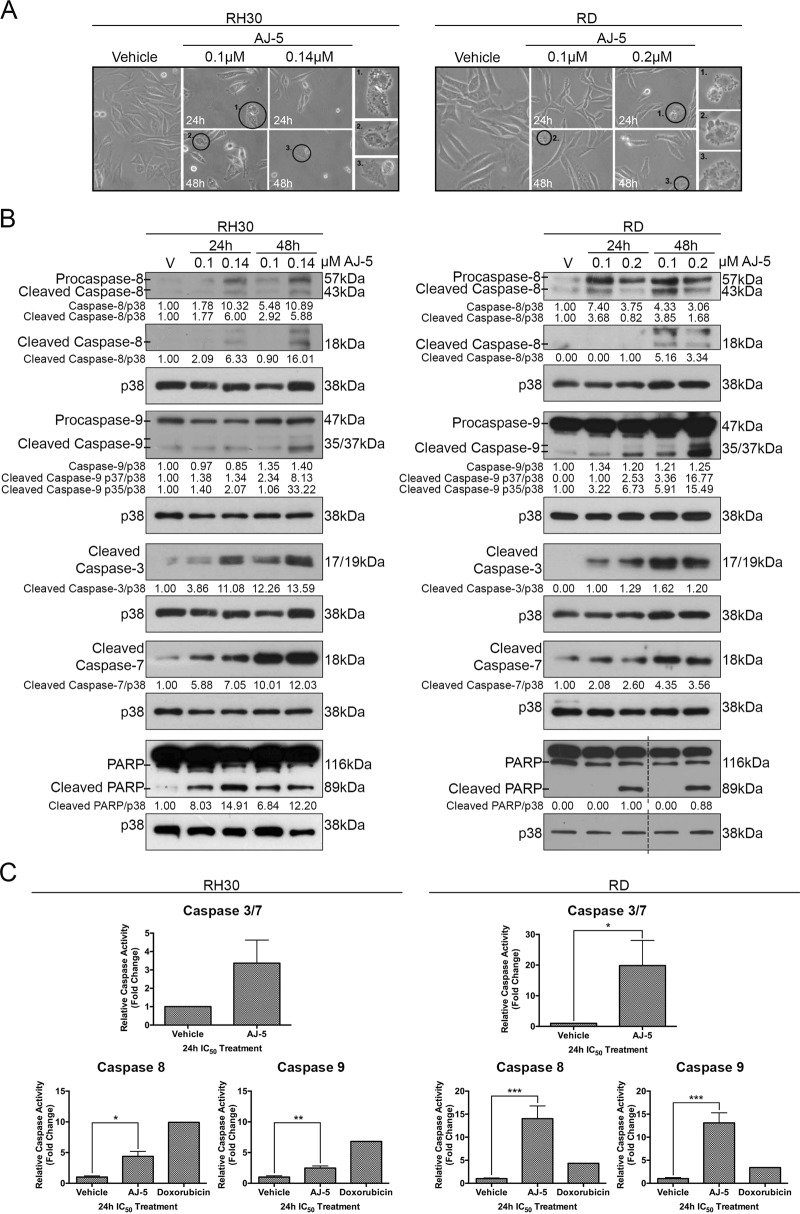
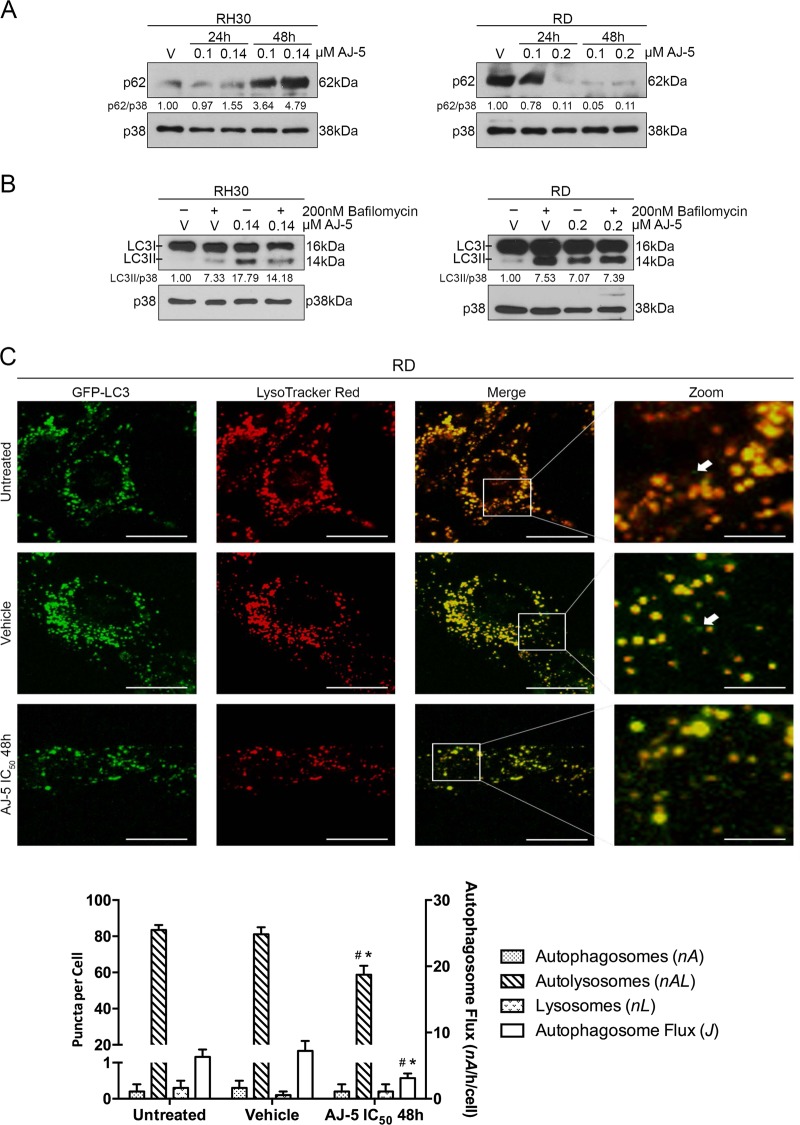
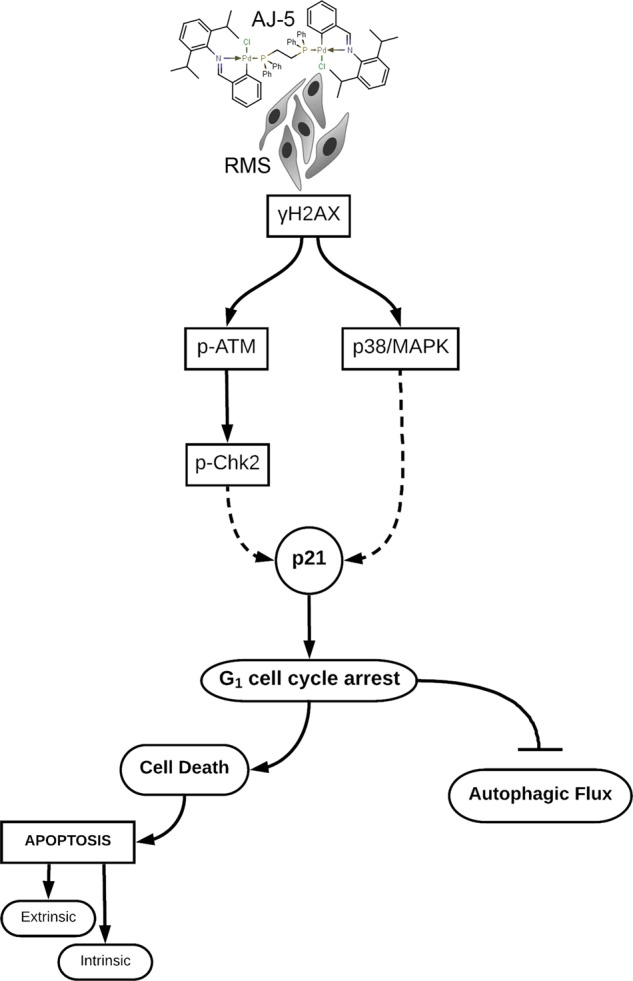
Rhabdomyosarcoma (RMS) forms in skeletal muscle and is the most common soft tissue sarcoma in children and adolescents. Current treatment is associated with debilitating side effects and treatment outcomes for patients with metastatic disease are dismal. Recently, a novel binuclear palladacycle, AJ-5, was shown to exert potent cytotoxicity in melanoma and breast cancer and to present with negligible adverse effects in mice. This study investigates the anti-cancer activity of AJ-5 in alveolar and embryonal RMS. IC50 values of ≤ 0.2 µM were determined for AJ-5 and it displayed a favourable selectivity index of >2. Clonogenic and migration assays showed that AJ-5 inhibited the ability of RMS cells to survive and migrate, respectively. Western blotting revealed that AJ-5 induced levels of key DNA damage response proteins (γH2AX, p-ATM and p-Chk2) and the p38/MAPK stress pathway. This correlated with an upregulation of p21 and a G1 cell cycle arrest. Annexin V-FITC/propidium iodide staining revealed that AJ-5 induced apoptosis and necrosis. Apoptosis was confirmed by the detection of cleaved PARP and increased levels and activity of cleaved caspases-3, -7, -8 and -9. Furthermore, AJ-5 reduced autophagic flux as shown by reduced LC3II accumulation in the presence of bafilomycin A1 and a significant reduction in autophagosome flux J. Finally, pharmacokinetic studies in mice show that AJ-5 has a promising half-life and that its volume of distribution is high, its clearance low and its intraperitoneal absorption is good. Together these findings suggest that AJ-5 may be an effective chemotherapeutic with a desirable mechanism of action for treating drug-resistant and advanced sarcomas.


Conflict of interest statement

The authors declare that they have no conflict of interest.

Figures

Fig. 1
Fig. 1. AJ-5 shows potent and selective cytotoxicity against aRMS and eRMS cells.
a MTT cell viability assays of aRMS cell lines, RH30 and AX-OH-1, and eRMS cell lines, RD and FL-OH-1, treated with a range of AJ-5 concentrations (0.1–1.0 µM) or vehicle for 48 h. Graphs show mean cell viability as a percentage of vehicle control ± SEM for each concentration of AJ-5 determined from three independent experiments performed in quadruplicate. A curve was fitted to determine the IC50 concentration of AJ-5 for each cell line. b Representative light microscopy images (×200; EVOS XL AMEX1000 Core Imaging System) of aRMS and eRMS cell lines treated with their respective IC50 concentrations of AJ-5 or vehicle for 24 and 48 h. c MTT cell viability assays of non-malignant human fibroblast cell lines, FG0 and DMB, mouse myoblast cell line, C2C12, and mesenchymal stem cell line, A10021501, treated with AJ-5 and IC50 concentrations determined as described in a above. Selectivity indices (SIs) were determined for each RMS cell line by dividing the IC50 of each non-malignant cell line by the IC50 of each RMS cell line
Fig. 2
Fig. 2. AJ-5 inhibits the ability of RMS cells to survive, proliferate and migrate.
a Representative images and quantification of clonogenic assays of eRMS and aRMS cells treated with vehicle, ¼ IC50, ½ IC50 or IC50 concentrations of AJ-5 for 24 h and then replated at low densities in drug-free medium and left for 7–21 days for colonies to form. Colonies were stained with crystal violet and images from three independent repeats were quantified using the ImageJ plugin ColonyArea. The graph represents the mean colony area ± SEM of each treatment condition as a percentage of the vehicle control. b The same as a above for the non-malignant mouse myoblast cell line C2C12, but treated with vehicle, 0.15 µM, 0.3 µM, or 0.6 µM AJ-5. c Representative images (×200; EVOS XL AMEX1000 Core Imaging System) and quantification of scratch motility assays of eRMS and aRMS cells pre-treated with IC50 concentrations of AJ-5 or vehicle for 24 h and then replated at 100% confluency in drug-free medium. After cell adherence, a sterile 2 µL pipette tip was used to make a linear wound in the cell monolayer and cells were treated with 10 µg/mL mitomycin C to inhibit proliferation. Cells were imaged at 0, 3, 6, 9, 12 and 24 h post wound formation. Total area migrated was calculated by subtracting the wound area at each time point from the wound area at time 0 h, which is represented in the graphs as mean area migrated ± SEM pooled from three independent repeats. Data were analysed using GraphPad Prism 6.0 and a parametric unpaired t-test was performed where *p < 0.05, **p < 0.01, ***p < 0.001
Fig. 3
Fig. 3. AJ-5 activates the DNA damage and the p38 MAPK pathways.
a γH2AX protein levels detected by western blotting in RH30 (aRMS) and RD (eRMS) cells treated with vehicle (V), 0.1 µM or IC50 AJ-5 for 24 and 48 h. p38 was used as a loading control. Densitometry readings were obtained using ImageJ and protein expression levels are represented as a ratio of protein of interest/p38 normalized to the vehicle control sample (where possible). Blots are representative of at least two independent repeats. b Representative confocal immunofluorescence maximum intensity projection images (×630; Carl Zeiss LSM 510) of RH30 and RD cells treated with IC50 AJ-5 or vehicle for 24 h and γH2AX detected with a fluorophore-conjugated Cy3 secondary antibody. Nuclei of cells were stained with DAPI. Scale bar is 20 µM. Box plots represent quantification of γH2AX levels per treatment condition as mean nuclear Cy3 fluorescence from 20 fields of view from three independent repeats. Data were analysed using GraphPad Prism 6.0 and a parametric unpaired t-test was performed where *p < 0.05, **p < 0.01, ***p < 0.001. c Western blot analyses with antibodies to key DNA damage and stress signalling pathway proteins: p-ATM, p-Chk2, p-p38, p53, and p21. RH30 and RD cells were treated with AJ-5 and protein expression quantified as described above in a. Broken lines in western blots shown in this figure indicate where lanes not relevant were removed
Fig. 4
Fig. 4. AJ-5 triggers a G1 cell cycle arrest and induces apoptotic and necrotic cell death in RH30 and RD cells.
a Flow cytometry analyses of cells treated with vehicle or IC50 AJ-5 for 24 and 48 h. Graphs represent the mean proportion of cells ± SEM at each phase of the cell cycle pooled from three independent repeats. b Western blot analyses of protein harvested from cells treated as indicated and incubated with antibodies against cell cycle markers cyclin A and cyclin B1. p38 was used as a loading control. Densitometry readings were obtained using ImageJ and protein expression levels are represented as a ratio of protein of interest/p38 normalized to the vehicle control sample. Blots are representative of at least two independent repeats. Broken lines indicate where lanes not relevant were removed. c Flow cytometric analyses of cells treated with vehicle or IC50 AJ-5 and stained with Annexin V-FITC and PI. Graphs represent the mean ± SEM percentage of viable (lower left-hand quadrant), apoptotic (lower right-hand quadrant + upper right-hand quadrant) and necrotic (upper left-hand quadrant) cells from three independent experiments. For a and c data were analysed using GraphPad Prism 6.0 and a parametric unpaired t-test was performed where *p < 0.05, **p < 0.01, ***p < 0.001
Fig. 5
Fig. 5. AJ-5 triggers the intrinsic and extrinsic apoptosis pathways in RMS cells.
a Representative light microcopy images (×200; EVOS XL AMEX1000 Core Imaging System) showing the morphology of RH30 and RD cells treated with vehicle, 0.1 µM or IC50 AJ-5 for 24 and 48 h. Numbered circles correspond to magnified images on the right, which highlight characteristic apoptotic morphology including membrane blebbing and cell shrinkage. b Western blot analyses of protein harvested from cells treated as in a and incubated with antibodies as indicated. p38 was used as a loading control and densitometry readings were obtained using ImageJ. Protein expression levels are represented as a ratio of protein of interest/p38 normalized to vehicle control samples (where possible). Blots are representative of at least two independent repeats. Broken lines indicate where lanes not relevant were removed. c Caspase-Glo assays showing the enzymatic activity of caspase-3/7, caspase-8 and caspase-9 for cells treated with vehicle or IC50 AJ-5. Doxorubicin was included as a positive control for caspase-8 and -9 assays at the IC50 concentration (0.5 µM) established in the cell lines tested. Graphs represent the mean fold change of caspase activity ± SEM pooled from three independent repeats. Data were analysed using GraphPad Prism 6.0 and a parametric unpaired t-test was performed where *p < 0.05, **p < 0.01, ***p < 0.001
Fig. 6
Fig. 6. AJ-5 reduces autophagic flux in RD and RH30 cells.
a Western blotting of p62/SQSTM1 protein levels in RH30 and RD cells treated with vehicle (V), 0.1 µM or IC50 AJ-5 for 24 and 48 h. b Western blotting showing LC3I and LC3II protein levels in RH30 and RD cells treated with vehicle (V) or IC50 AJ-5 for 24 h followed by 2 h of treatment with 200 nM bafilomycin A1. For western blots, p38 was used as a loading control and densitometry readings were obtained using ImageJ. Protein expression levels are represented as a ratio of protein of interest/p38 normalized to vehicle control sample. Blots are representative of at least two independent repeats. c Representative single-cell fluorescence maximum intensity projection micrographs (×630; Carl Zeiss LSM 780; scale bar is 20 µM) and pool size quantification of autophagy pathway intermediates: autophagosomes (GFP-LC3, nA) (indicated with white arrows in the merged image), autolysosomes (LysoTracker Red, nAL) and lysosomes (merged, nL). Autophagosome flux J was calcuclated. Data were analysed using GraphPad Prism 6.0 and a parametric unpaired t-test was performed *p < 0.05, **p < 0.01, ***p < 0.001. # compared to untreated control, * compared to vehicle control
Fig. 7
Fig. 7. Proposed model for AJ-5 in RMS.
At low concentrations (≤0.2 µM) in aRMS and eRMS cells AJ-5 induces DSBs leading to increased levels of γH2AX and activation of both the canonical DSB pathway (ATM/Chk2) and the p38/MAPK stress signalling pathway. This results in a p21-induced G1 cell cycle arrest followed by the activation of the extrinsic and intrinsic apoptotic pathways and a reduction in autophagic flux

References

    1. Stout AP. Rhabdomyosarcoma of the skeletal muscles. Ann. Surg. 1946;123:447–472. doi: 10.1097/00000658-194603000-00011. - DOI - PubMed
    1. Dagher R, Helman L. Rhabdomyosarcoma: an overview. Oncologist. 1999;4:34–44. - PubMed
    1. Perez EA, et al. Rhabdomyosarcoma in children: a SEER population based study. J. Surg. Res. 2011;170:e243–e251. doi: 10.1016/j.jss.2011.03.001. - DOI - PubMed
    1. Wachtel M, et al. Subtype and prognostic classification of rhabdomyosarcoma by immunohistochemistry. J. Clin. Oncol. 2006;24:816–822. doi: 10.1200/JCO.2005.03.4934. - DOI - PubMed
    1. Ward E, DeSantis C, Robbins A, Kohler B, Jemal A. Childhood and adolescent cancer statistics, 2014. CA Cancer J. Clin. 2014;64:83–103. doi: 10.3322/caac.21219. - DOI - PubMed