. 2019 Jan 24:2:34.
doi: 10.1038/s42003-018-0273-6. eCollection 2019.

Collective cell migration of Dictyostelium without cAMP oscillations at multicellular stages

Affiliations

Collective cell migration of Dictyostelium without cAMP oscillations at multicellular stages

Hidenori Hashimura et al. Commun Biol. .

Abstract

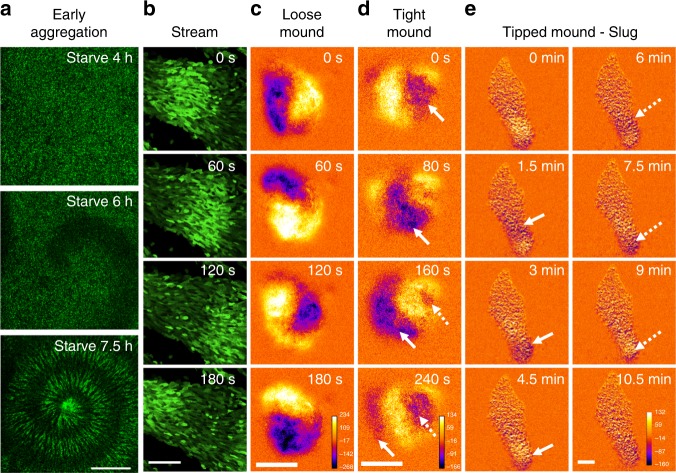
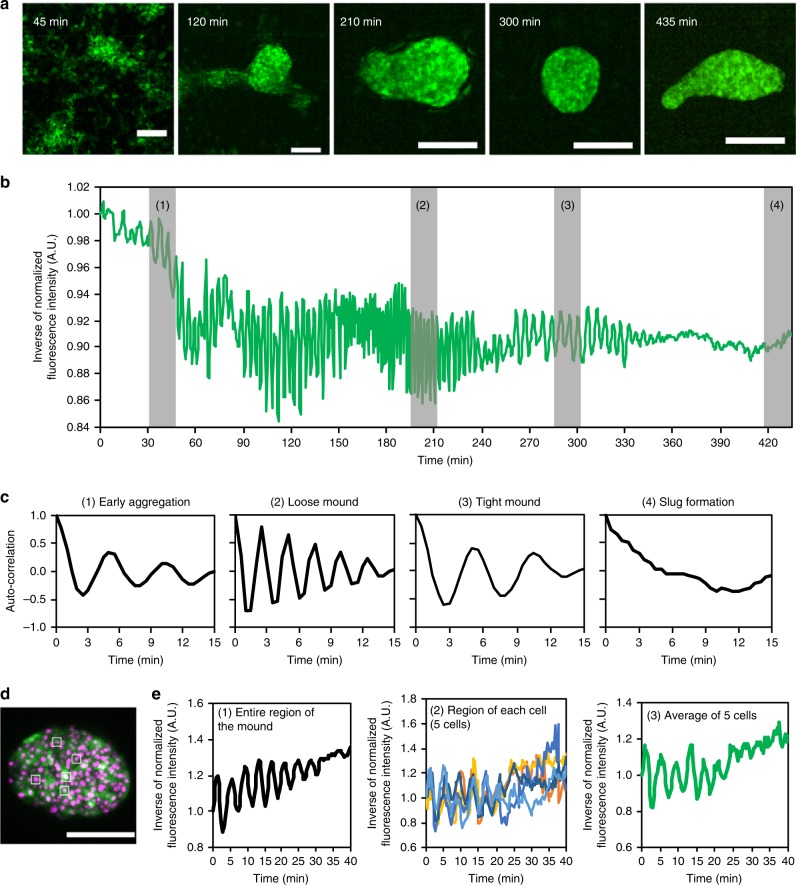
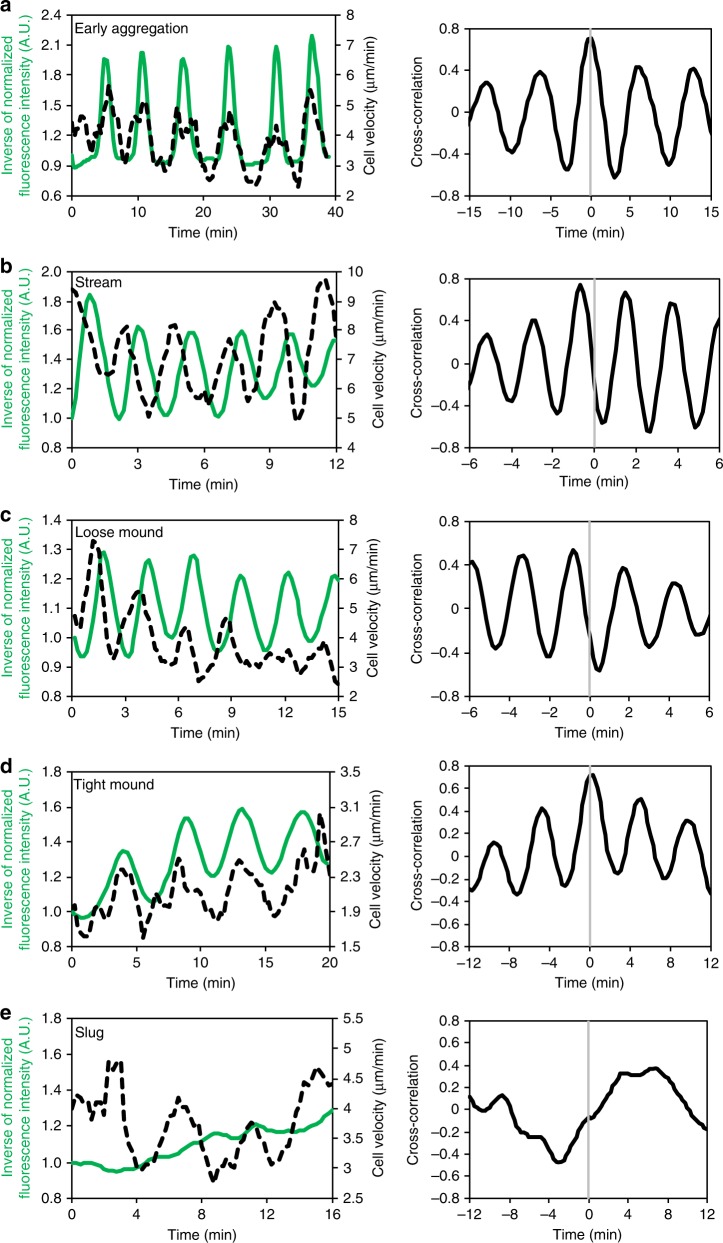
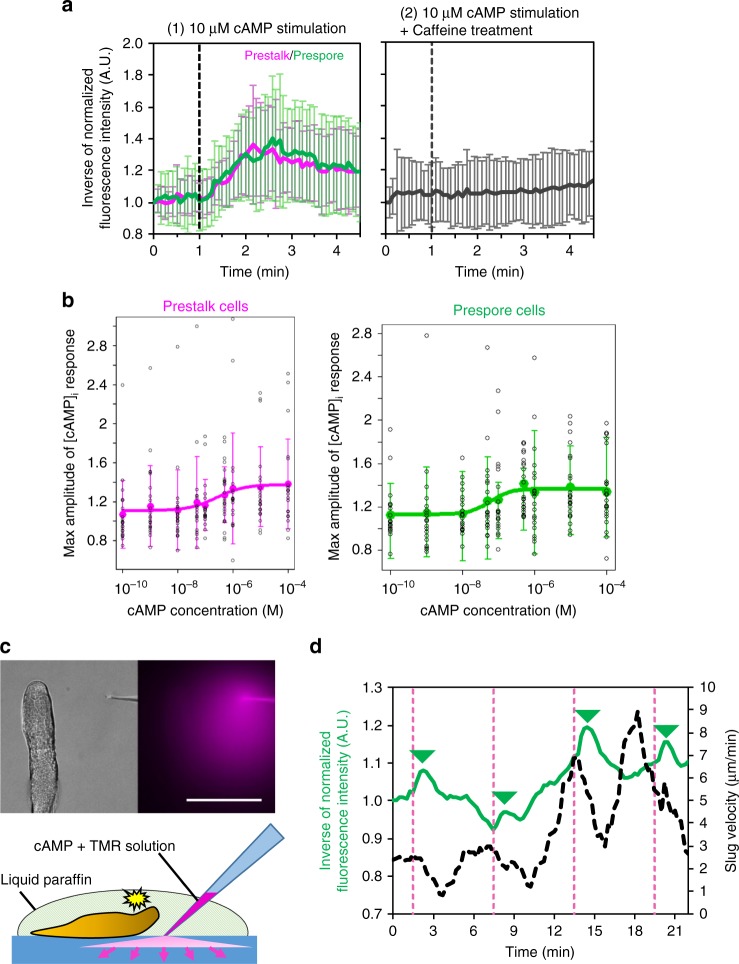
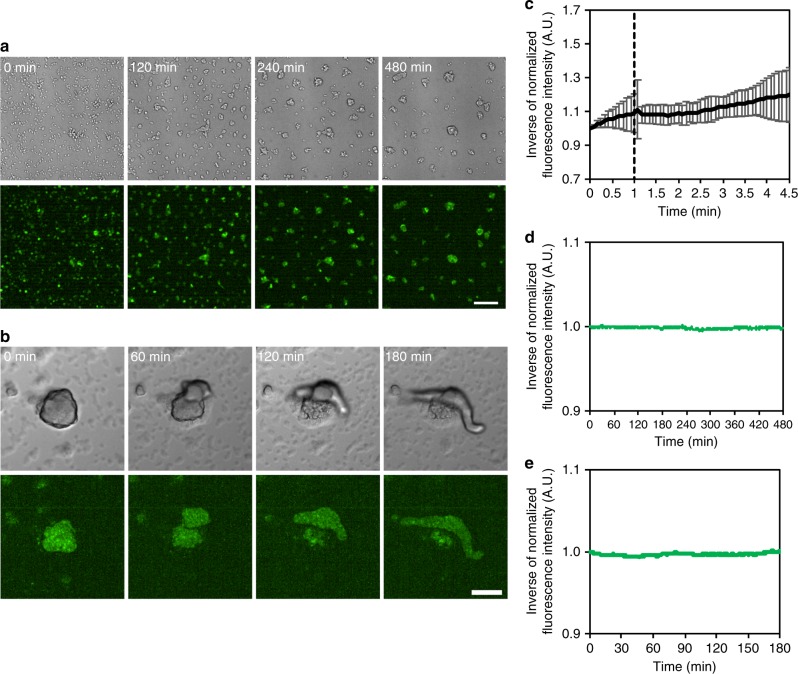
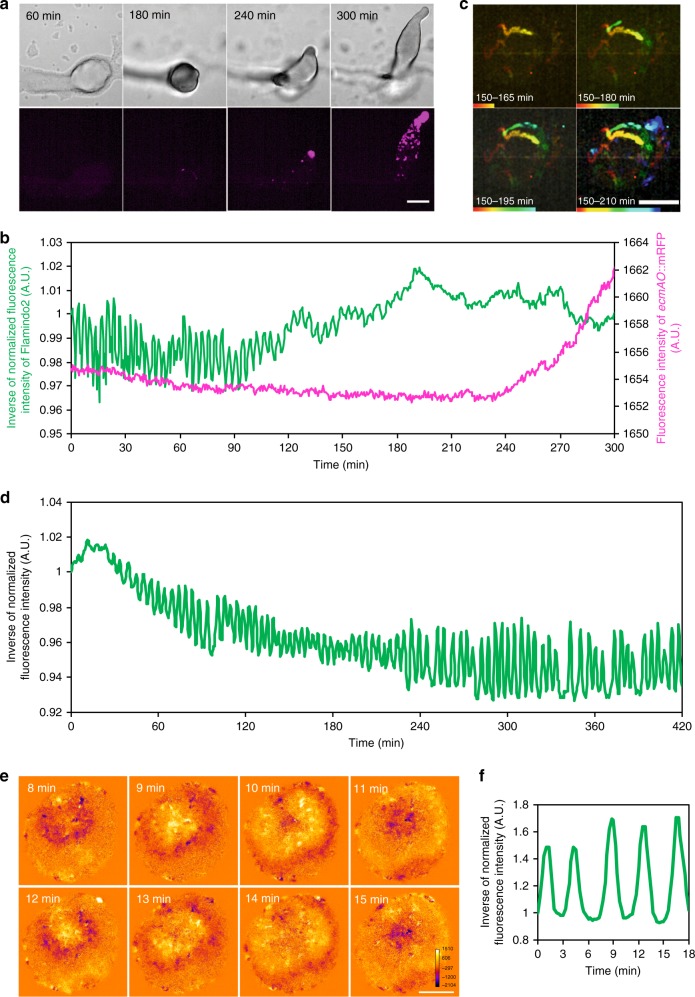
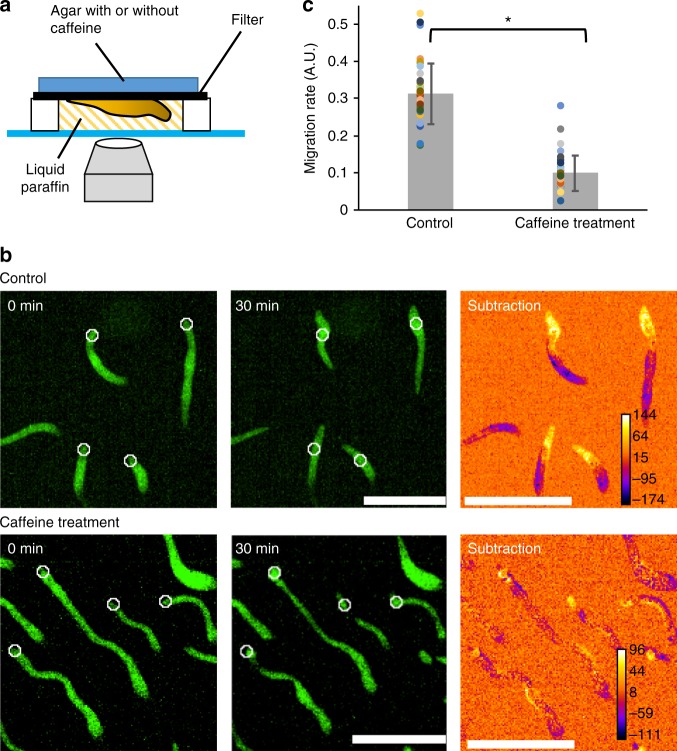
In Dictyostelium discoideum, a model organism for the study of collective cell migration, extracellular cyclic adenosine 3',5'-monophosphate (cAMP) acts as a diffusible chemical guidance cue for cell aggregation, which has been thought to be important in multicellular morphogenesis. Here we revealed that the dynamics of cAMP-mediated signaling showed a transition from propagating waves to steady state during cell development. Live-cell imaging of cytosolic cAMP levels revealed that their oscillation and propagation in cell populations were obvious for cell aggregation and mound formation stages, but they gradually disappeared when multicellular slugs started to migrate. A similar transition of signaling dynamics occurred with phosphatidylinositol 3,4,5-trisphosphate signaling, which is upstream of the cAMP signal pathway. This transition was programmed with concomitant developmental progression. We propose a new model in which cAMP oscillation and propagation between cells, which are important at the unicellular stage, are unessential for collective cell migration at the multicellular stage.


Conflict of interest statement

The authors declare no competing interests.

Figures

Fig. 1
Fig. 1
Typical cAMP signaling dynamics at each developmental stage of Dictyostelium cells visualized by Flamindo2. a Spiral pattern of a [cAMP]i wave in cell populations at early aggregation. b Wave propagation in an aggregating stream. c Rotational propagation in a loose mound. d Wave propagation from the top of a tight mound (right side of images) to the bottom. e A slug with a stream elongating toward the top of the images. In ce, images were subtracted at 3–6 frame intervals to emphasize changes in fluorescence intensity. Solid and broken arrows show the positions of the first and second waves in each sequential image, respectively. Scale bars, a 1 mm, b, e 100 μm, c, d 50 μm
Fig. 2
Fig. 2
Disappearance of [cAMP]i oscillations during development. a Fluorescent images of Dictyostelium cells expressing Flamindo2 in each developmental stage. Maximum intensity projections of Z-stack images are shown. Scale bars, 100 μm. b Time course plot of inverse Flamindo2 signals during development from the onset of aggregation to slug formation. Data were obtained 3.5–10.75 h after starvation. The mean intensity of Flamindo2 in a 30 μm2 region in the cell population shown in a was measured. c Autocorrelation of Flamindo2 signals at each development stage are shown by the gray bars in b. d A fluorescence image of Flamindo2 and Histone2B-RFP in an elongating mound. The maximum intensity projection of Z-stacks is shown. Scale bar, 50 μm. e Time course plot of inverse Flamindo2 signals at the tissue (first) or individual cell level (second and third) in the mound shown in d. First, average signals in the entire region of the mound. Second, signals in 5 cells indicated by the white boxes in d. In the second graph, individual cells were tracked, and Flamindo2 intensities within each cell were measured. Third, average of the signals in the second graph
Fig. 3
Fig. 3
Simultaneous monitoring of [cAMP]i and cell velocity at each developmental stage. Left graphs show time-course plots of [cAMP]i (green solid lines) and cell velocity (black dashed lines). Individual cells were tracked, and Flamindo2 intensities within each cell and cell velocities were measured. The signals of Flamindo2 and cell velocities were averaged across several representative cells, and the averages of representative cells are plotted against time. The curves of Flamindo2 signals and cell velocities were smoothed by a running average over four data points. Right graphs show the cross-correlation between [cAMP]i and cell velocity shown in the left graphs. a Early aggregation (n = 20 cells). b Aggregation stream (n = 14 cells). c Loose mound (n = 12 cells). d Tight mound (n = 10 cells). e Slug (n = 10 cells)
Fig. 4
Fig. 4
[cAMP]i response of slug cells to external cAMP stimulation. a Time course plot of inverse Flamindo2 signals in slug-dissociated cells after 10 μM cAMP stimulation (mean ± SD). Left, no-treatment cells (magenta, prestalk cells, n = 22 cells; green, prespore cells, n = 22 cells). Right, caffeine-treated cells (n = 45). b A dose-dependent curve of [cAMP]i response to various concentrations of cAMP stimuli (0.01–10 μM, mean ± SD). Magenta, prestalk cells (n = 20–24 cells at each data point). Green, prespore cells (n = 20–22 cells at each data point). c External cAMP stimulation to the slug by injection of cAMP into agar near the slug from a microcapillary. Left, DIC image. Right, fluorescent image of diffusing dye mixed with cAMP to visualize the injected solution. Scale bar, 100 μm. Bottom, a scheme of the cAMP microinjection experiment. cAMP solution mixed with the dye is diffused from the tip of a micropipette into agar to stimulate the entire slug. d Time-course plot of inverse Flamindo2 signals in whole slug (green solid line) and slug velocity (black dashed line). Dashed magenta lines indicate time of the cAMP injection. The mean intensity of Flamindo2 in a 43 × 186 μm2 region in the slug shown in c was measured. The curves of slug velocity were smoothed by a running average over six data points. The peaks of Flamindo2 signals after cAMP stimulation are shown as green triangles
Fig. 5
Fig. 5
Development of acaA-null cells without [cAMP]i oscillations. a Aggregation of acaA-null cells expressing Flamindo2 in DB with exogenous cAMP pulses under microscopic observation. Top panels, DIC images. Lower panels, fluorescent images of Flamindo2. Scale bar, 100 μm. b Slug formation of acaA-null cells expressing Flamindo2 on agar. Cells were washed and deposited on an agar plate after cAMP pulses. Upper panels, DIC images. Lower panels, fluorescent images of Flamindo2. Inside the fluorescent images, maximum intensity projections of Z-stacks are shown. Scale bar, 100 μm. c Time-course plot of Flamindo2 signals in cell clumps after 100 μM cAMP stimulation. The mean intensity of Flamindo2 in a 25 μm2 region in the cell mass was measured, and the inverse of the fluorescence intensity of Flamindo2 is plotted on the y-axis (mean ± SD, n = 13 clumps). d Time-course plot of Flamindo2 signals in acaA-null cells during aggregation. The mean intensity of Flamindo2 in a 100 μm2 region on the aggregation field shown in a was measured, and the inverse of the fluorescence intensity was plotted against time. e Time-course plot of Flamindo2 signals in acaA-null cells during slug formation. The mean intensity of Flamindo2 in a 100 μm2 region in the cell mass shown in b was measured, and the inverse of the fluorescence intensity was plotted against time
Fig. 6
Fig. 6
Association of cAMP signaling transition with developmental progression. a Expression of ecmAO::mRFPmars during mound development. Upper panels, DIC images. Lower panels, fluorescent images of ecmAO::mRFPmars. Scale bar, 100 μm. b Time course plot of Flamindo2 (green) and ecmAO::mRFPmars (magenta) signals during mound development. Data were obtained 8–13 h after starvation. The mean intensity of Flamindo2 in a 30 μm2 region in the mound shown in a and the mean intensity of ecmAO::mRFPmars in the entire region of the mound were measured. c The sorting of cells expressing ecmAO::mRFPmars at the top of the tight mound. This figure shows trajectories of sorted prestalk cells marked by the expression of ecmAO::mRFPmars at the top of the mound (upper right side of images) during the mound elongation. Scale bars, 100 μm. d Time course plot of inverse Flamindo2 signals during the development of gbfA cells. Data were obtained 3–10 h after starvation. The mean intensity of Flamindo2 in a 50 μm2 region of the cell population was measured. e Wave propagation of Flamindo2 signals in the loose mound of gbfA cells after 24 h starvation. Images were subtracted at 4 frame intervals to emphasize changes in the signals. Scale bar, 50 μm. f Time course plot of inverse Flamindo2 signals in the mound shown in e. The mean intensity of Flamindo2 in a 20 μm2 region in the mound shown in e was measured
Fig. 7
Fig. 7
Caffeine treatment inhibits slug migration. a The scheme of experiments for monitoring the effect of caffeine on slug migration. Slugs were formed on a filter. Agar containing 0 mM (control) or 4 mM caffeine was put on the filter during the observation. b Snapshots of migrating slugs with or without 4 mM caffeine treatment. Fluorescent images of slugs expressing Citrine at t = 0 (left) and 30 min (middle) and subtracted images of the two (right) are shown. In the subtracted images, the yellow zones around the tips of the slugs indicate the migration space for 30 min. White circles shown in the t = 0 and 30 min images indicate the positions of the tips of the slugs at t = 0 min. Scale bars, 500 μm. c Comparison of migration rates between no treatment (Control) and caffeine-treated slugs (Caffeine treatment). n = 36 slugs for both groups (mean ± SD). Dots represent original data. *P < 10–20, Student’s two-tailed t-test

References

    1. Friedl P, Gilmour D. Collective cell migration in morphogenesis, regeneration and cancer. Nat. Rev. Mol. Cell Biol. 2009;10:445–457. doi: 10.1038/nrm2720. - DOI - PubMed
    1. Rørth P. Collective cell migration. Annu. Rev. Cell Dev. Biol. 2009;25:407–429. doi: 10.1146/annurev.cellbio.042308.113231. - DOI - PubMed
    1. Haeger A, Wolf K, Zegers MM, Friedl P. Collective cell migration: guidance principles and hierarchies. Trends Cell Biol. 2015;25:556–566. doi: 10.1016/j.tcb.2015.06.003. - DOI - PubMed
    1. Weijer CJ. Collective cell migration in development. J. Cell. Sci. 2009;122:3215–3223. doi: 10.1242/jcs.036517. - DOI - PubMed
    1. Tomchik KJ, Devreotes PN. Adenosine 3’, 5’-monophosphate waves in Dictyostelium discoideum: a demonstration by isotope dilution-fluorography. Science. 1981;212:443–446. doi: 10.1126/science.6259734. - DOI - PubMed

Publication types