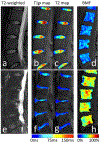
Associations between vertebral body fat fraction and intervertebral disc biochemical composition as assessed by quantitative MRI
- PMID: 30701594
- PMCID: PMC6667309
- DOI: 10.1002/jmri.26675
Associations between vertebral body fat fraction and intervertebral disc biochemical composition as assessed by quantitative MRI
Abstract
Background: There is an interplay between the intervertebral disc (IVD) and the adjacent bone marrow that may play a role in the development of IVD degeneration and might influence chronic lower back pain (CLBP).
Purpose: To apply novel quantitative MRI techniques to assess the relationship between vertebral bone marrow fat (BMF) and biochemical changes in the adjacent IVD.
Study type: Prospective.
Subjects: Forty-six subjects (26 female and 20 male) with a mean age of 47.3 ± 12.0 years.
Field strength/sequence: 3 T MRI; a combined T1ρ and T2 mapping pulse sequence and a 3D spoiled gradient recalled sequence with six echoes and iterative decomposition of water and fat with echo asymmetry and least-squares estimation (IDEAL) reconstruction algorithm.
Assessment: Using quantitative MRI, the vertebral BMF fraction was measured as well as the biochemical composition (proteoglycan and collagen content) of the IVD. Furthermore, clinical Pfirrmann grading, Oswestry disability index (ODI), and visual analog scale (VAS) was assessed.
Statistical tests: Mixed random effects models accounting for multiple measurements per subject were used to assess the relationships between disc measurements and BMF.
Results: The relationships between BMF (mean) and T1ρ /T2 (mean and SD) were significant, with P < 0.05. Significant associations (P < 0.001) were found between clinical scores (Pfirrmann, ODI, and VAS) with T1ρ /T2 (mean and SD). BMF mean was significantly related to ODI (P = 0.037) and VAS (P = 0.043), but not with Pfirrmann (P = 0.451). In contrast, BMF SD was significantly related to Pfirrmann (P = 0.000) but not to ODI (P = 0.064) and VAS (P = 0.13).
Data conclusion: Our study demonstrates significant associations between BMF and biochemical changes in the adjacent IVD, both assessed by quantitative MRI; this may suggest that the conversion of hematopoietic bone marrow to fatty bone marrow impairs the supply of available nutrients to cells in the IVD and may thereby accelerate disc degeneration.
Level of evidence: 2 Technical Efficacy Stage: 3 J. Magn. Reson. Imaging 2019;50:1219-1226.
Keywords: bone marrow fat; chronic lower back pain; intervertebral disc degeneration; spine.
© 2019 International Society for Magnetic Resonance in Medicine.
Figures


References
-
- Katz JN. Lumbar disc disorders and low-back pain: socioeconomic factors and consequences. The Journal of bone and joint surgery 2006;88 Suppl 2:21–24. - PubMed
-
- Jacobs JJ, Andersson GB, Bell JE, et al. The burden of musculoskeletal diseases in the United States. Rosemont, IL: American Academy of Orthopaedic Surgeons: 2008.
-
- Montazel JL, Divine M, Lepage E, Kobeiter H, Breil S, Rahmouni A. Normal spinal bone marrow in adults: dynamic gadolinium-enhanced MR imaging. Radiology 2003;229(3):703–709. - PubMed
-
- De Bisschop E, Luypaert R, Louis O, Osteaux M. Fat fraction of lumbar bone marrow using in vivo proton nuclear magnetic resonance spectroscopy. Bone 1993;14(2):133–136. - PubMed
-
- Lee JM, Song JY, Baek M, et al. Interleukin-1beta induces angiogenesis and innervation in human intervertebral disc degeneration. J Orthop Res;29(2):265–269. - PubMed
Publication types
MeSH terms
Grants and funding
LinkOut - more resources
Full Text Sources
Medical
Research Materials

