. 2019 May;55(5):905-919.
doi: 10.1037/dev0000683. Epub 2019 Jan 31.

Cues to individuation facilitate 6-month-old infants' visual short-term memory

Affiliations

Cues to individuation facilitate 6-month-old infants' visual short-term memory

Lisa M Cantrell et al. Dev Psychol. 2019 May.

Abstract

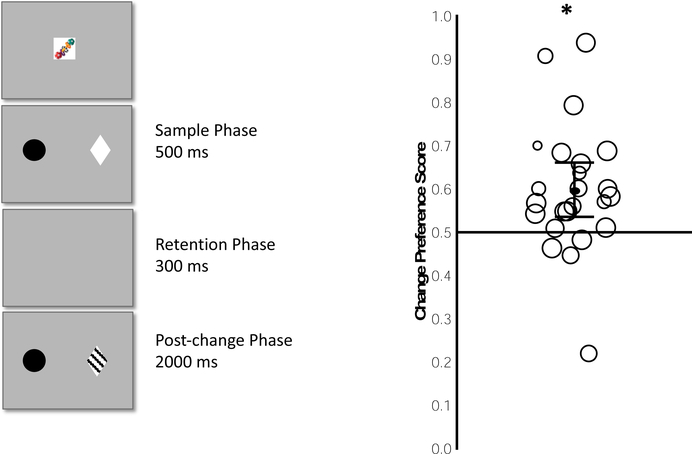
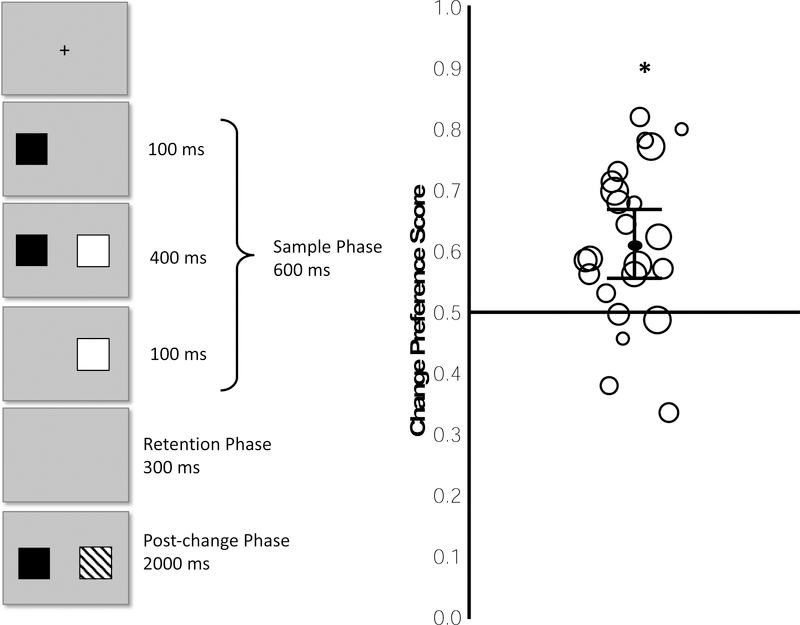
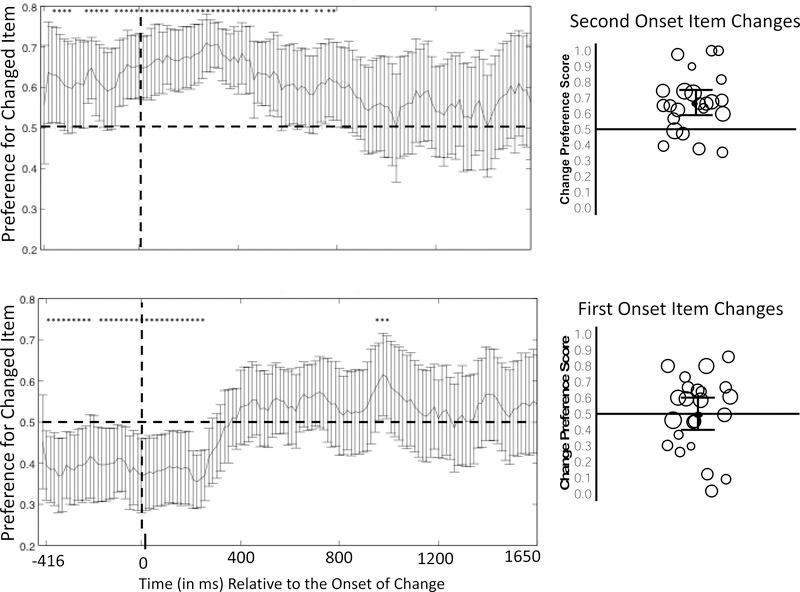
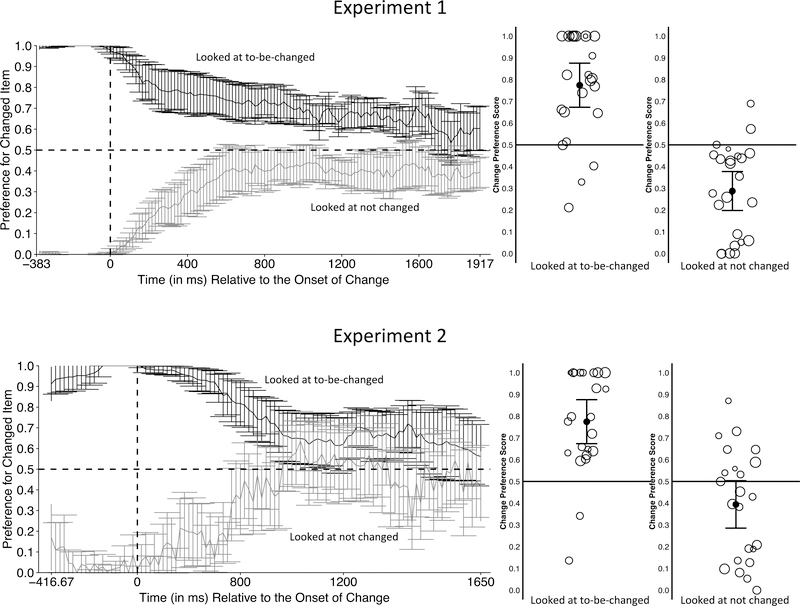
Infants' ability to perform visual short-term memory (VSTM) tasks develops rapidly between 6 and 8 months. Here we tested the hypothesis that infants' VSTM performance is influenced by their ability to individuate simultaneously presented objects. We used a one-shot change detection task to ask whether 6-month-old infants (N = 47) would detect a change in the color of 1 item in a 2-item array when the stimulus context facilitated individuation of the items. In Experiment 1 the 2 items in the display differed in shape and color and in Experiment 2 the onset and offset times of the 2 items differed. In both experiments, 6-month-old infants detected a change, contrasting with previous results. Thus, young infants' encoding of information about individual items in multiple-item arrays is related to their ability to individuate those items. (PsycINFO Database Record (c) 2019 APA, all rights reserved).


Figures

Figure 1.
Figure 1.
Depiction of a single trial in Experiment 1 (left) and observed Change Preference Scores (right). Each circle in the right panel represents the median preference score from a single infant; the individual circles are scaled to the number of trials completed and values are scattered horizontally solely to make the individual circles easier to see. The black line within the cloud of circles indicates the mean of the preference scores, with the 95% confidence interval shown by error bars. * = p >. 05 for one-sample t test against chance.
Figure 2.
Figure 2.
Proportion of trials across all infants in Experiment 1 which gaze was directed to one of the two objects at each sample point (and therefore contributed data that could be used to assess the preference for the changed object). The horizontal light dotted line indicates the 50% cut-off threshold for trials. The vertical light dotted line indicates the point in the trial where the stimulus presentation changes (post-change phase). The solid dark line reflects the proportion of trials with observed data. The thick broken lines indicate the first and last points at which at least 50% of all trials had fixations recorded to one or the other item (the other trials had fixations directed to other locations on the screen or off the screen altogether). These lines also indicate the analysis window for the Monte Carlo time-course analysis (see text). The analysis window for the preference score is shown in the shaded area, which begins 200 ms after the post-change onset and ends at the end of the analysis window (1917 ms).
Figure 3.
Figure 3.
Preference for the changed item at each time point as a function of time relative to the onset of post-change phase in Experiment 1. The solid graphed line represents the change preference at each time point, and the vertical bars represent the 95% confidence interval at each of those time points. Each time point that was significantly greater than chance (without correction for multiple comparisons) is indicated by an asterisk. The set of asterisks from 566.7 to 1066.7 ms formed a cluster that was statistically significant after correction for multiple comparisons as determined by our permutation analyses (see text for details).
Figure 4.
Figure 4.
Distribution of run lengths obtained from 1000 permutations of the data in Experiment 1. This is the distribution of values that would be expected by chance (the null distribution). The dotted line indicates the 95% cutoff (i.e., 95% of the permutation iterations had run lengths shorter than this). We considered any observed run length from the actual data in Experiment 1 above this cutoff as statistically significant.
Figure 5.
Figure 5.
Depiction of a single trial in Experiment 2 (left) and observed Change Preference Scores (right). Each circle in right panel represents the median preference score from a single infant; the individual values are scaled to reflect the number of trials completed and are scattered horizontally to make the individual circles easier to see. The black line within the cloud of circles indicates the mean of the preference scores, with the 95% confidence interval shown by error bars. * = p , >05 for one-sample t test against chance.
Figure 6.
Figure 6.
Proportion of trials across all infants in Experiment 2 which gaze was directed to one of the two objects at each sample point (and therefore contributed data that could be used to assess the preference for the changed object). The lighter horizontal dotted line indicate the 50% cut-off. The vertical dotted line indicates the point in the trial where the change occurs (post-change phase onset). The solid dark line reflects the proportion of trials with observed data. The thick broken vertical lines indicate the first and last points at which at least 50% of all trials had fixations recorded to one or the other item (the other trials had fixations directed to other locations on the screen or off the screen altogether). These lines also indicate the analysis window for the Monte Carlo time-course analysis (see text). The analysis window for the preference score is shown in the shaded area, which begins 200 ms after the post-change onset and ends at the end of the analysis window.
Figure 7.
Figure 7.
Preference for the changed item as a function of time relative to the onset of post-change phase in Experiment 2. Each time point that was significantly greater than chance (without correction for multiple comparisons) is indicated by an asterisk. The set of asterisks from 283.33 – 933.33 ms formed a cluster that was statistically significant after correction for multiple comparisons.
Figure 8.
Figure 8.
Distribution of run lengths obtained from 1000 permutations of the data in Experiment 2. This is the distribution of values that would be expected by chance (the null distribution). The dotted line indicates the 95% cutoff (i.e., 95% of the permutation iterations had run lengths shorter than this). We considered any observed run length from the actual data in Experiment 2 above this cutoff as statistically significant.
Figure 9.
Figure 9.
Separate time course of change preference (left) and median of mean change preference scores collapsed over the entire preference score window (right) in Experiment 2 for trials in which the second-appearing item changed (top) and trials in which the first-appearing item changed (bottom). In the time course plots, samples in which the preferences differs significantly from chance are indicated with an asterisk. Note in the bottom graph, infants begin to prefer the second onset item before the change, and maintain a preference for that item after the change, despite the fact it is the non-changing item. In the collapsed data, each circle represents the preference score from a single infant. The black line within the cloud of circles indicates the mean of the median preference scores, with the 95% confidence interval shown by the gray error bars.
Figure 10.
Figure 10.
Separate time course graphs (left) for Experiments 1 and 2 depicting trials in which infants looked longer at the to-be-changed item or the non-changing item during the prechange phase and graphs for each kind of trial (right) depicting the median of mean change preference scores collapsed over the entire preference score window. In the collapsed data, each circle represents the preference score from a single infant. The black line within the cloud of circles indicates the mean of the median preference scores, with the 95% confidence interval shown by the gray error bars.

References

    1. Alvarez GA, & Cavanagh P (2004). The capacity of visual short-term memory Is set both by visual information load and by number of objects. Psychological Science, 15, 106–111. DOI: 10.1111/j.0963-7214.2004.01502006.x - DOI - PubMed
    1. Aslin RN, & Salapatek P (1975). Saccadic localization of visual targets by the very young human infant. Perception & Psychophysics, 17, 293–302. DOI: 10.3758/BF03203214 - DOI
    1. Awh E, Barton B, & Vogel EK (2007). Visual working memory represents a fixed number of items regardless of complexity. Psychological Science, 18, 622–628. - PubMed
    1. Bullmore ET, Suckling J, Overmeyer S, Rabe-Hesketh S, Taylor E, & Brammer MJ (1999). Global, voxel, and cluster tests, by theory and permutation, for a difference between two groups of structural mr images of the brain. IEEE Transactions on Medical Imaging, 18, 32–42. DOI: 10.1109/42.750253 - DOI - PubMed
    1. Carey S, & Xu F (2001). Infants’ knowledge of objects: Beyond object files and object tracking. Cognitive Psychology, 80, 179–213. - PubMed