

Whole Genome Messenger RNA Profiling Identifies a Novel Signature to Predict Gastric Cancer Survival
- PMID: 30702489
- PMCID: PMC6369880
- DOI: 10.14309/ctg.0000000000000004
Whole Genome Messenger RNA Profiling Identifies a Novel Signature to Predict Gastric Cancer Survival
Abstract
Objectives: Molecular prognostic biomarkers for gastric cancer (GC) are still limited. We aimed to identify potential messenger RNAs (mRNAs) associated with GC prognosis and further establish an mRNA signature to predict the survival of GC based on the publicly accessible databases.
Methods: Discovery of potential mRNAs associated with GC survival was undertaken for 441 patients with GC based on the Cancer Genome Atlas (TCGA), with information on clinical characteristics and vital status. Gene ontology functional enrichment analysis and pathway enrichment analysis were conducted to interrogate the possible biological functions. We narrowed down the list of mRNAs for validation study based on a significance level of 1.00 × 10, also integrating the information from the methylation analysis and constructing the protein-protein interaction network for elucidating biological processes. A total of 54 mRNAs were further studied in the validation stage, using the Gene Expression Omnibus (GEO) database (GSE84437, n = 433). The validated mRNAs were used to construct a risk score model predicting the prognosis of GC.
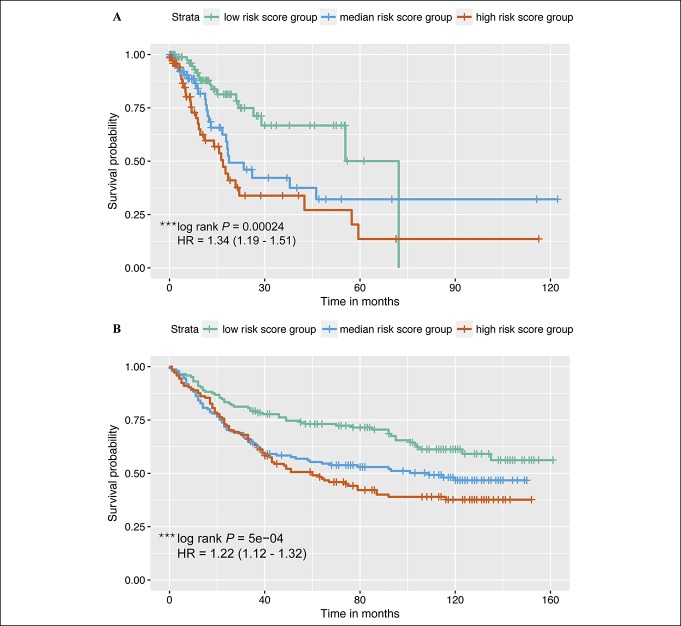
Results: A total of 13 mRNAs were significantly associated with survival of GC, after the validation stage, including DCLK1, FLRT2, MCC, PRICKLE1, RIMS1, SLC25A15, SLCO2A1, CDO1, GHR, CD109, SELP, UPK1B, and CD36. Except CD36, DCLK1, and SLCO2A1, other mRNAs are newly reported to be associated with GC survival. The 13 mRNA-based risk score had good performance on distinguishing GC prognosis, with a higher score indicating worse survival in both TCGA and GEO datasets.
Conclusions: We established a 13-mRNA signature to potentially predict the prognosis of patients with GC, which might be useful in clinical practice for informing patient stratification.
Figures


Similar articles
-
A Robust Circular RNA-Associated Three-Gene Prognostic Signature for Patients with Gastric Cancer.Biomed Res Int. 2021 Apr 21;2021:6633289. doi: 10.1155/2021/6633289. eCollection 2021. Biomed Res Int. 2021. PMID: 33969120 Free PMC article.
-
Identification of functional lncRNAs in gastric cancer by integrative analysis of GEO and TCGA data.J Cell Biochem. 2019 Oct;120(10):17898-17911. doi: 10.1002/jcb.29058. Epub 2019 May 28. J Cell Biochem. 2019. PMID: 31135068
-
LASSO‑based Cox‑PH model identifies an 11‑lncRNA signature for prognosis prediction in gastric cancer.Mol Med Rep. 2018 Dec;18(6):5579-5593. doi: 10.3892/mmr.2018.9567. Epub 2018 Oct 22. Mol Med Rep. 2018. PMID: 30365077 Free PMC article.
-
DNA methylation signatures associated with prognosis of gastric cancer.BMC Cancer. 2021 May 25;21(1):610. doi: 10.1186/s12885-021-08389-0. BMC Cancer. 2021. PMID: 34034702 Free PMC article.
-
Systematic Review of Prognostic Gene Signature in Gastric Cancer Patients.Front Bioeng Biotechnol. 2020 Jul 31;8:805. doi: 10.3389/fbioe.2020.00805. eCollection 2020. Front Bioeng Biotechnol. 2020. PMID: 32850704 Free PMC article.
Cited by
-
Identification of a seven-cell cycle signature predicting overall survival for gastric cancer.Aging (Albany NY). 2022 May 10;14(9):3989-3999. doi: 10.18632/aging.204060. Epub 2022 May 10. Aging (Albany NY). 2022. PMID: 35537781 Free PMC article.
-
Aberrant methylation in neurofunctional gene serves as a hallmark of tumorigenesis and progression in colorectal cancer.BMC Cancer. 2023 Apr 6;23(1):315. doi: 10.1186/s12885-023-10765-x. BMC Cancer. 2023. PMID: 37020199 Free PMC article.
-
A universal molecular prognostic score for gastrointestinal tumors.NPJ Genom Med. 2021 Feb 4;6(1):6. doi: 10.1038/s41525-021-00172-1. NPJ Genom Med. 2021. PMID: 33542224 Free PMC article.
-
Identification of biomarkers predicting the chemotherapeutic outcomes of capecitabine and oxaliplatin in patients with gastric cancer.Oncol Lett. 2020 Dec;20(6):290. doi: 10.3892/ol.2020.12153. Epub 2020 Sep 24. Oncol Lett. 2020. PMID: 33029206 Free PMC article.
-
KRT13 and UPK1B for differential diagnosis between metastatic lung carcinoma from oral squamous cell carcinoma and lung squamous cell carcinoma.Sci Rep. 2023 Dec 18;13(1):22626. doi: 10.1038/s41598-023-49545-9. Sci Rep. 2023. PMID: 38114532 Free PMC article.
References
-
- Torre LA, Bray F, Siegel RL, et al. Global cancer statistics, 2012. CA Cancer J Clin 2015;65:87–108. - PubMed
-
- Graziano F, Mandolesi A, Ruzzo A, et al. Predictive and prognostic role of E-cadherin protein expression in patients with advanced gastric carcinomas treated with palliative chemotherapy. Tumour Biol 2004;25:106–10. - PubMed
-
- Tanigawa N, Amaya H, Matsumura M, et al. Correlation between expression of vascular endothelial growth factor and tumor vascularity, and patient outcome in human gastric carcinoma. J Clin Oncol 1997;15:826–32. - PubMed
-
- Sanz-Ortega J, Steinberg SM, Moro E, et al. Comparative study of tumor angiogenesis and immunohistochemistry for p53, c-ErbB2, c-myc and EGFr as prognostic factors in gastric cancer. Histol Histopathol 2000;15:455–62. - PubMed
Publication types
MeSH terms
Substances
LinkOut - more resources
Full Text Sources
Medical
Miscellaneous
