

Celecoxib With Neoadjuvant Chemotherapy for Breast Cancer Might Worsen Outcomes Differentially by COX-2 Expression and ER Status: Exploratory Analysis of the REMAGUS02 Trial
- PMID: 30702971
- PMCID: PMC6804843
- DOI: 10.1200/JCO.18.00636
Celecoxib With Neoadjuvant Chemotherapy for Breast Cancer Might Worsen Outcomes Differentially by COX-2 Expression and ER Status: Exploratory Analysis of the REMAGUS02 Trial
Abstract
Purpose: The overexpression of cyclooxygenase 2 (COX-2) gene, also known as prostaglandin-endoperoxide synthase 2 ( PTGS2), occurs in breast cancer, but whether it affects response to anticox drugs remains unclear. We investigated the relationships between PTGS2 expression, celecoxib use during neoadjuvant chemotherapy (NAC), and both event-free survival (EFS) and overall survival (OS).
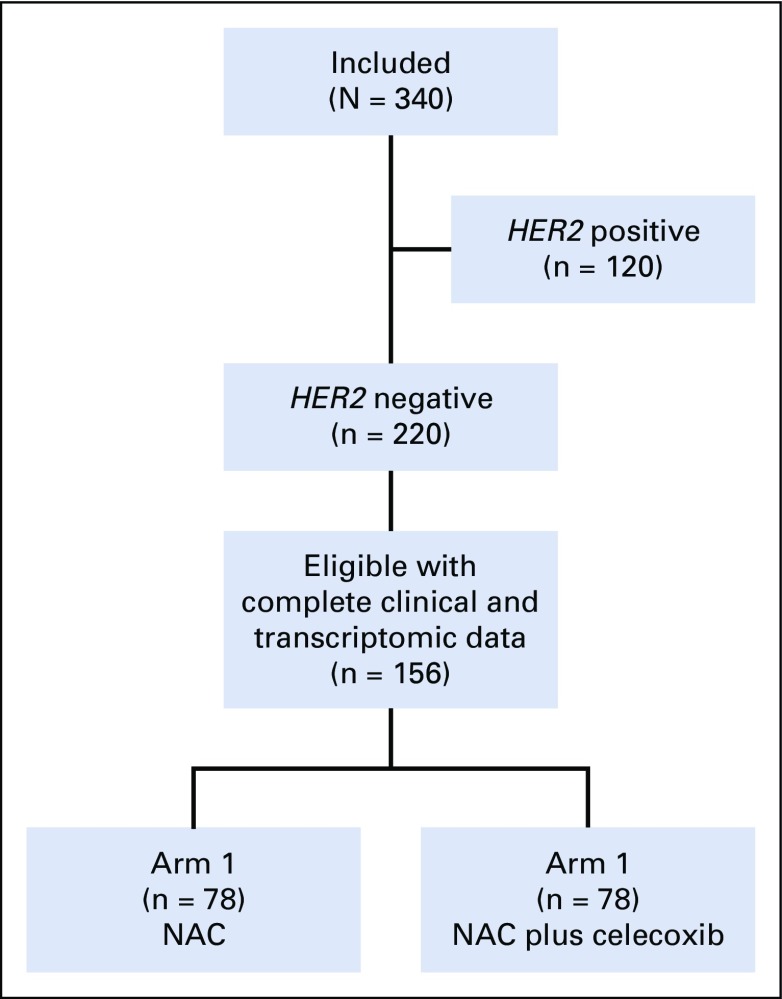
Materials and methods: We analyzed a cohort of 156 patients with human epidermal growth factor receptor 2 -negative breast cancer from the REMAGUS02 (ISRCTN Registry No. 10059974) trial with pretreatment PTGS2 expression data. Patients were treated by sequential NAC (epirubicin plus cyclophosphamide followed by docetaxel with or without celecoxib). Experimental validation was performed on breast cancer cell lines. The Cancer and Leukemia Group B (CALGB) 30801 ( ClinicalTrials.gov identifier: NCT01041781) trial that tested chemotherapy with or without celecoxib in patients with lung cancer served as an independent validation cohort.
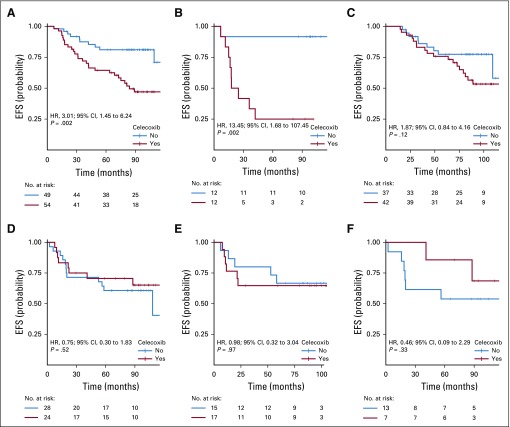
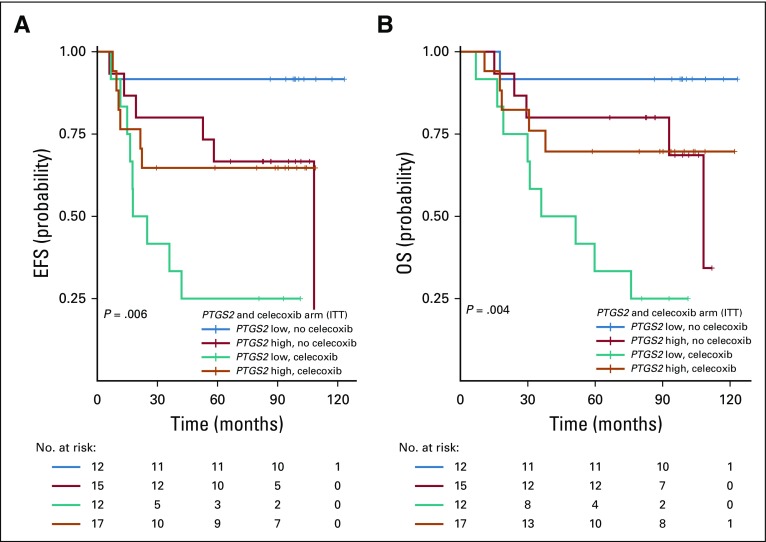
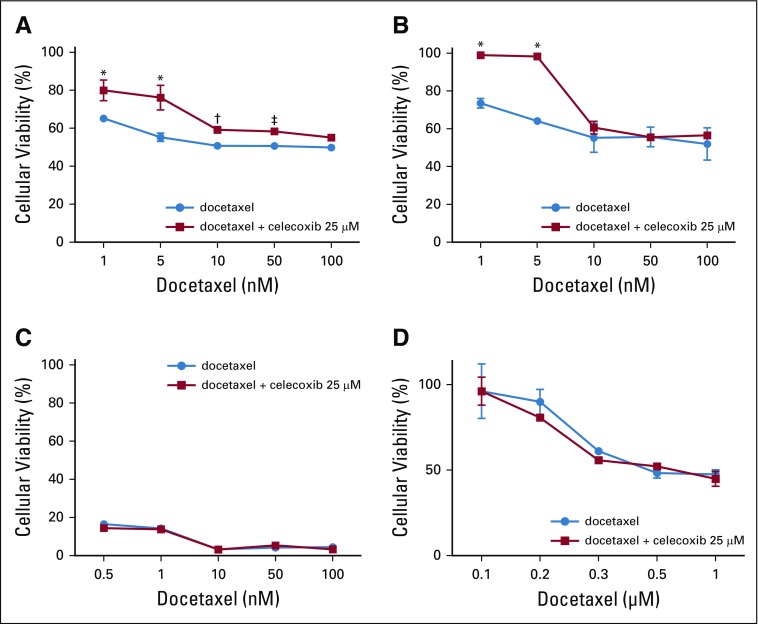
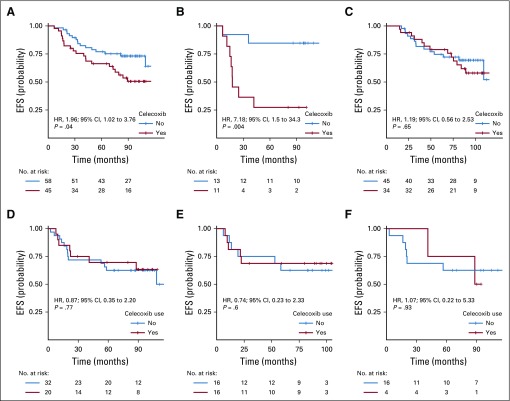
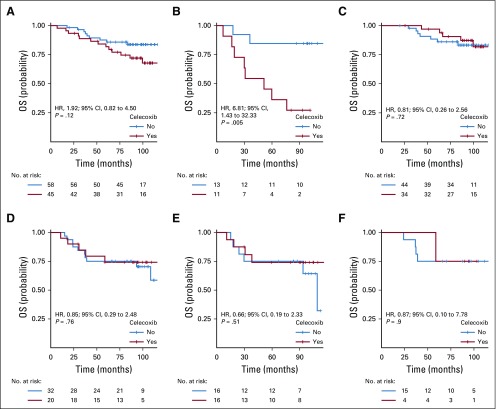
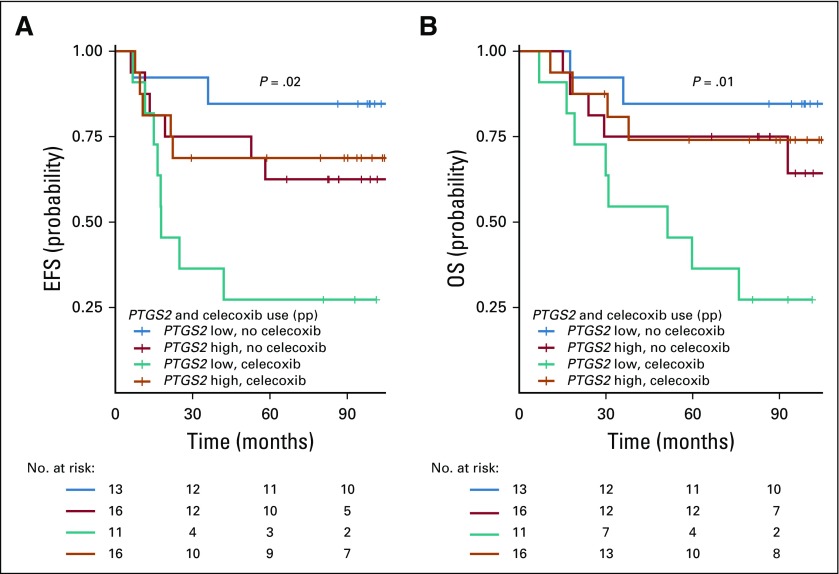
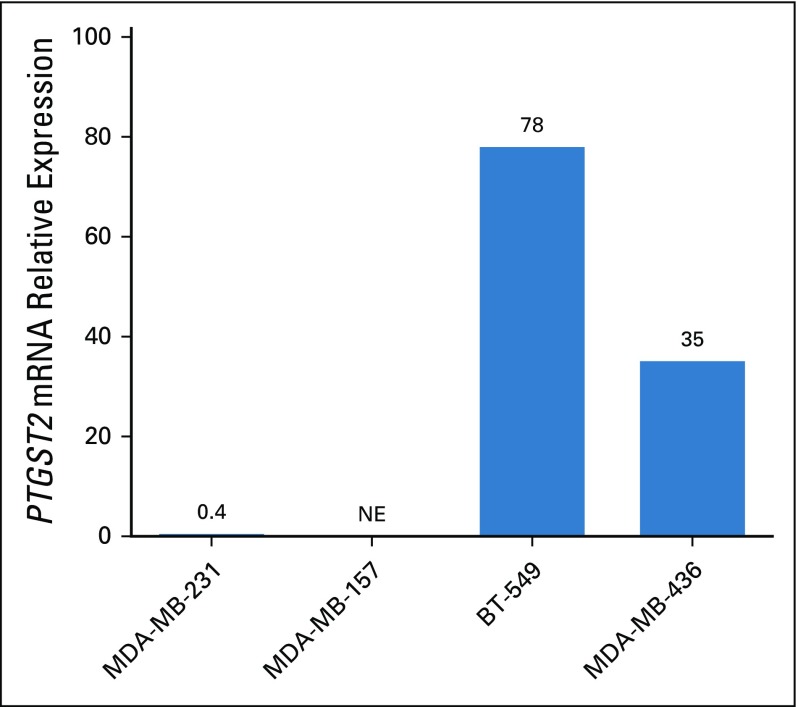
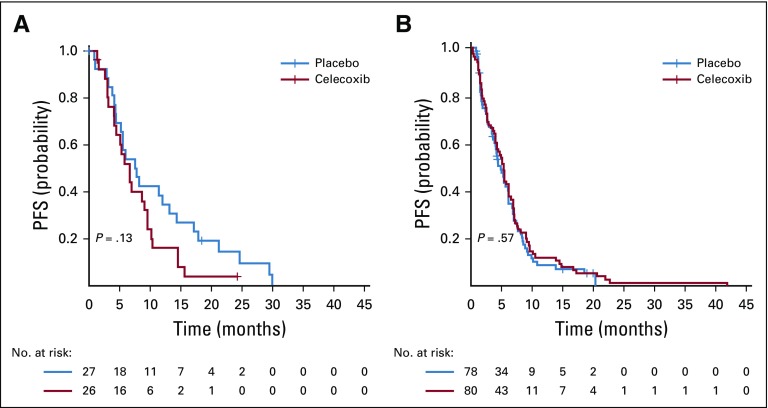
Results: After 94.5 months of follow-up, EFS was significantly lower in the celecoxib group (hazard ratio [HR], 1.7; 95% CI, 1 to 2.88; P = .046). A significant interaction between PTGS2 expression and celecoxib use was detected ( Pinteraction = .01). In the PTGS2-low group (n = 100), EFS was lower in the celecoxib arm (HR, 3.01; 95% CI, 1.45 to 6.24; P = .002) than in the standard treatment arm. Celecoxib use was an independent predictor of poor EFS, distant relapse-free survival, and OS. Celecoxib in addition to docetaxel enhanced cell viability in PTGS2-low cell lines but not in PTGS2-high cell lines. In CALGB 30801, a trend toward poorer progression-free survival was observed in the patients with low urinary metabolite of prostaglandin E2 who received celecoxib (HR = 1.57; 95% CI, 0.87 to 2.84; P = .13).
Conclusion: Celecoxib use during chemotherapy adversely affected survival in patients with breast cancer, and the effect was more marked in PTGS2-low and/or estrogen receptor-negative tumors. COX-2 inhibitors should preferably be avoided during docetaxel use in patients with breast cancer who are undergoing NAC.
Figures

Similar articles
-
Effects of Celecoxib and Low-dose Aspirin on Outcomes in Adjuvant Aromatase Inhibitor-Treated Patients: CCTG MA.27.J Natl Cancer Inst. 2018 Sep 1;110(9):1003-1008. doi: 10.1093/jnci/djy017. J Natl Cancer Inst. 2018. PMID: 29554282 Free PMC article. Clinical Trial.
-
Effect of Tailored Dose-Dense Chemotherapy vs Standard 3-Weekly Adjuvant Chemotherapy on Recurrence-Free Survival Among Women With High-Risk Early Breast Cancer: A Randomized Clinical Trial.JAMA. 2016 Nov 8;316(18):1888-1896. doi: 10.1001/jama.2016.15865. JAMA. 2016. PMID: 27825007 Clinical Trial.
-
Neoadjuvant everolimus plus letrozole versus fluorouracil, epirubicin and cyclophosphamide for ER-positive, HER2-negative breast cancer: study protocol for a randomized pilot trial.Trials. 2017 Oct 25;18(1):497. doi: 10.1186/s13063-017-2228-5. Trials. 2017. PMID: 29070044 Free PMC article. Clinical Trial.
-
The role of COX-2 inhibition in breast cancer treatment and prevention.Semin Oncol. 2004 Apr;31(2 Suppl 7):22-9. doi: 10.1053/j.seminoncol.2004.03.042. Semin Oncol. 2004. PMID: 15179621 Review.
-
Evaluation of Pathologic Complete Response as a Surrogate for Long-Term Survival Outcomes in Triple-Negative Breast Cancer.J Natl Compr Canc Netw. 2020 Aug;18(8):1096-1104. doi: 10.6004/jnccn.2020.7550. J Natl Compr Canc Netw. 2020. PMID: 32755985 Review.
Cited by
-
MAGI1, a New Potential Tumor Suppressor Gene in Estrogen Receptor Positive Breast Cancer.Cancers (Basel). 2020 Jan 16;12(1):223. doi: 10.3390/cancers12010223. Cancers (Basel). 2020. PMID: 31963297 Free PMC article.
-
Causal analyses of the impact of comorbid conditions and concomitant medications on response to neoadjuvant chemotherapy in breast cancer: analysis of a multicenter prospective cohort study (CANTO).ESMO Open. 2025 May;10(5):104507. doi: 10.1016/j.esmoop.2025.104507. Epub 2025 May 15. ESMO Open. 2025. PMID: 40378528 Free PMC article.
-
Immunosuppressive reprogramming of neutrophils by lung mesenchymal cells promotes breast cancer metastasis.Sci Immunol. 2023 Feb 24;8(80):eadd5204. doi: 10.1126/sciimmunol.add5204. Epub 2023 Feb 17. Sci Immunol. 2023. PMID: 36800412 Free PMC article.
-
Anti-Angiogenic Treatments Interact with Steroid Secretion in Inflammatory Breast Cancer Triple Negative Cell Lines.Cancers (Basel). 2021 Jul 21;13(15):3668. doi: 10.3390/cancers13153668. Cancers (Basel). 2021. PMID: 34359570 Free PMC article.
-
Identification of the effects of COVID-19 on patients with pulmonary fibrosis and lung cancer: a bioinformatics analysis and literature review.Sci Rep. 2022 Sep 26;12(1):16040. doi: 10.1038/s41598-022-20040-x. Sci Rep. 2022. PMID: 36163484 Free PMC article. Review.
References
-
- Arber N. Cyclooxygenase-2 inhibitors in colorectal cancer prevention: Point. Cancer Epidemiol Biomarkers Prev. 2008;17:1852–1857. - PubMed
-
- Singh-Ranger G, Salhab M, Mokbel K. The role of cyclooxygenase-2 in breast cancer: Review. Breast Cancer Res Treat. 2008;109:189–198. - PubMed
-
- Arun B, Goss P. The role of COX-2 inhibition in breast cancer treatment and prevention. Semin Oncol. 2004;31:22–29. - PubMed
Publication types
MeSH terms
Substances
Associated data
Grants and funding
LinkOut - more resources
Full Text Sources
Medical
Research Materials
