. 2019 Mar 1;240(3):483-496.
doi: 10.1530/JOE-18-0623.

Vagal afferents contribute to sympathoexcitation-driven metabolic dysfunctions

Affiliations

Vagal afferents contribute to sympathoexcitation-driven metabolic dysfunctions

L Francisco Lorenzo-Martín et al. J Endocrinol. .

Abstract

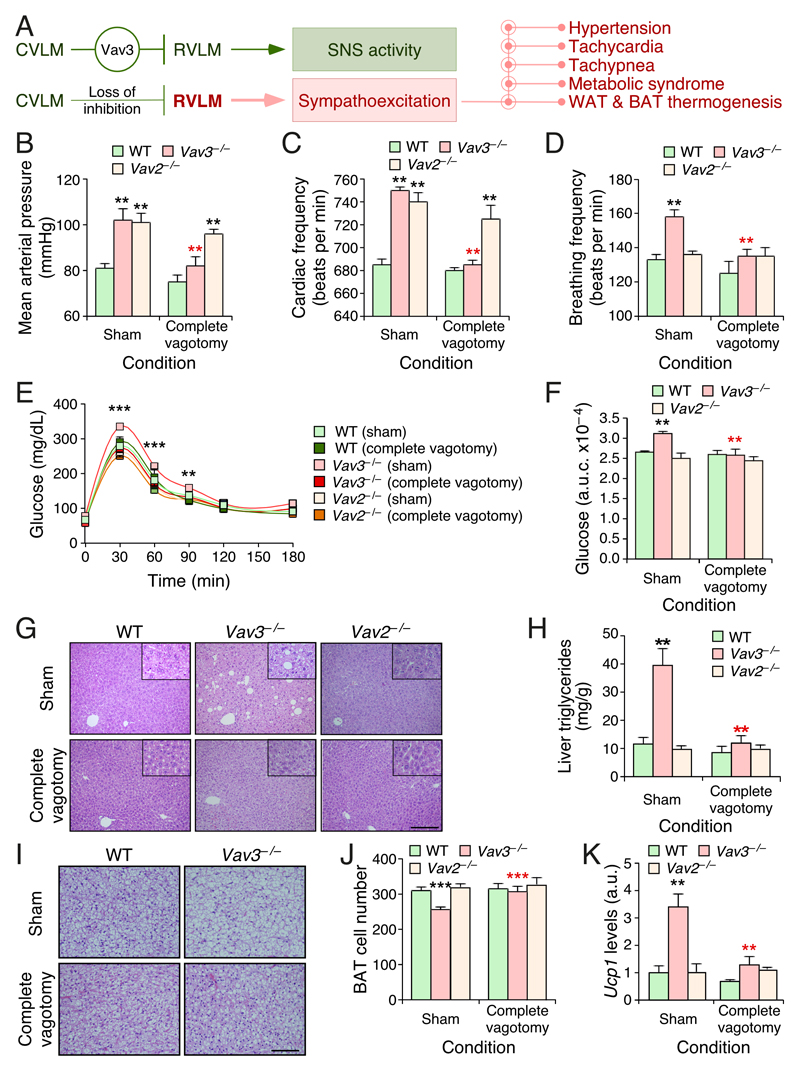
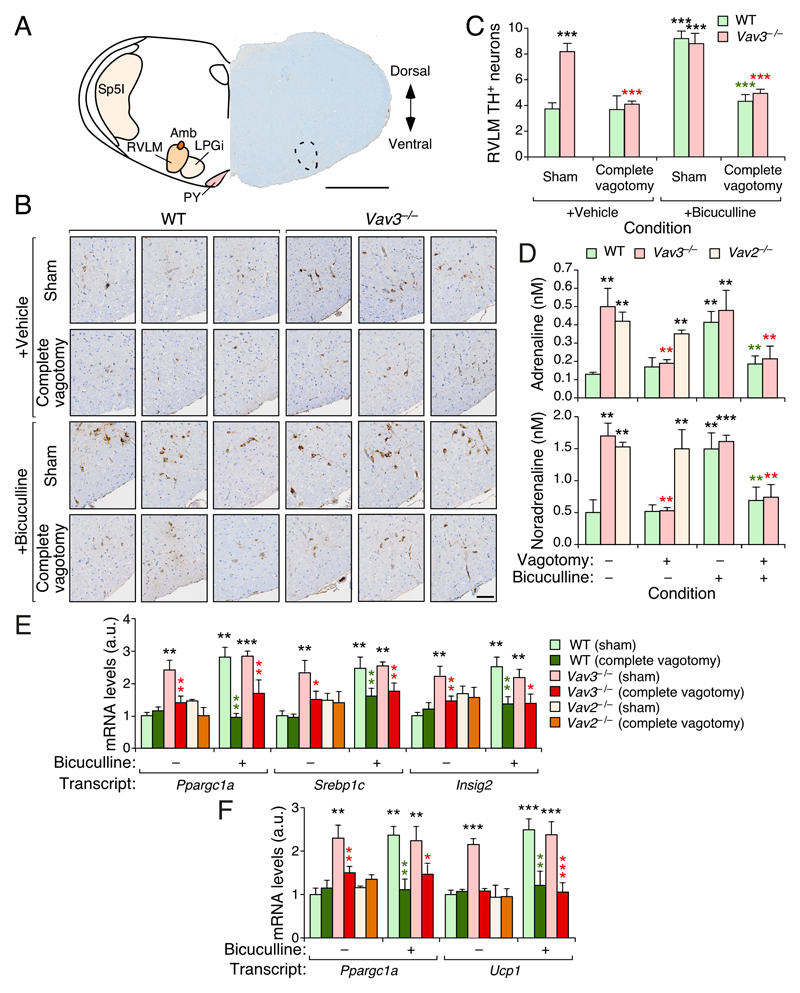
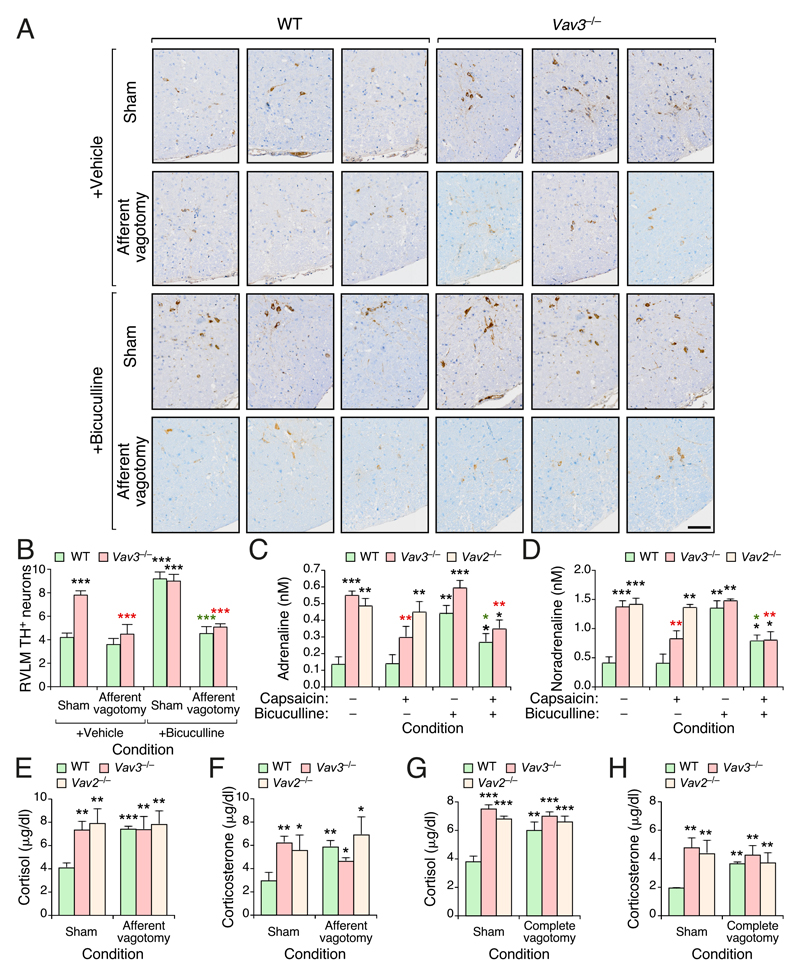
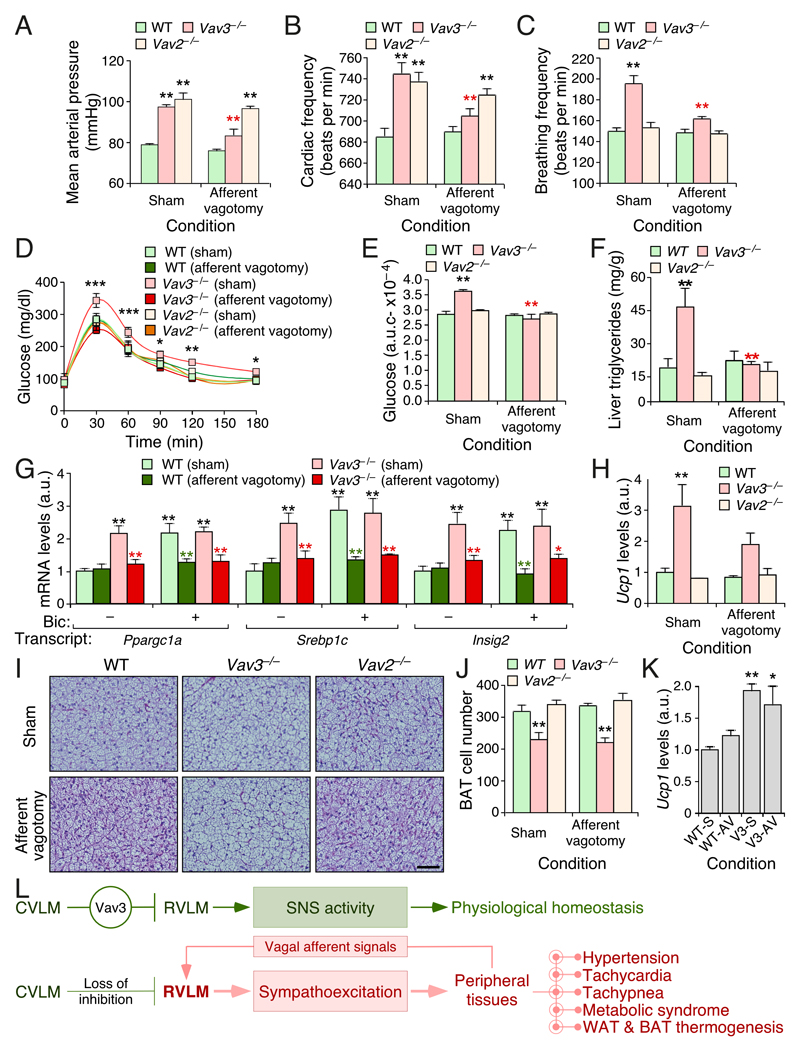
Multiple crosstalk between peripheral organs and the nervous system are required to maintain physiological and metabolic homeostasis. Using Vav3-deficient mice as a model for chronic sympathoexcitation-associated disorders, we report here that afferent fibers of the hepatic branch of the vagus nerve are needed for the development of the peripheral sympathoexcitation, tachycardia, tachypnea, insulin resistance, liver steatosis and adipose tissue thermogenesis present in those mice. This neuronal pathway contributes to proper activity of the rostral ventrolateral medulla, a sympathoregulatory brainstem center hyperactive in Vav3-/- mice. Vagal afferent inputs are also required for the development of additional pathophysiological conditions associated with deregulated rostral ventrolateral medulla activity. By contrast, they are dispensable for other peripheral sympathoexcitation-associated disorders sparing metabolic alterations in liver.

Keywords: GABAergic signals; adipose tissue; brainstem; diabetes; hypertension; liver; metabolic syndrome; sympathetic system; thermogenesis; ventrolateral medulla.


Conflict of interest statement

Conflicts of Interest

The authors report no conflict of interest associated with this work.

Figures

Figure 1
Figure 1. Complete subdiaphragmatic vagotomy blocks chronic sympathoexcitation–driven dysfunctions in mice
(A) Scheme of the regulatory status of the RVLM and downstream pathways in WT (green, top) and Vav3–/– (red, bottom) mice. (B–D) Mean arterial pressure (B), heart frequency (C), and breathing ratio (D) of mice of indicated genotypes (inset) and experimental conditions (bottom). (E) Glucose tolerance test in mice of indicated genotypes and experimental conditions. (F) Area under the curve (a.u.c.) of the glucose tolerance tests performed in (E). (G) Representative images of histological sections obtained from livers of mice of the indicated genotypes and experimental groups. Scale bar, 200 μm. (H) Triglyceride content of livers from mice of the indicated genotypes and experimental groups. (I) Representative histological images of interscapular BAT sections from mice of the indicated genotypes and experimental groups. Scale bar, 100 μm. (J) Quantification of the number of brown adipocytes per field in interscapular BAT from mice of the indicated genotypes and experimental groups. (K) Levels of indicated transcripts in the WAT from mice of indicated genotypes and experimental groups. Values are shown relative to the abundance of each transcript in the sham operated WT control (which was given an arbitrary value of 1). a.u., arbitrary number. Data shown in panels B–F, H, and J–K represent mean ± SEM. *, P ≤ 0.05; **, P ≤ 0.01; ***, P ≤ 0.001 relative to either sham operated WT (black asterisks) or the sham operated animals of the same genotype group (red asterisks). Student’s t and Mann–Whitney U tests were used for data obtained in panels (B–F,J) and (H,K), respectively. n = 13 (sham operated WT), 12 (sham operated Vav3–/– mice), 5 (sham operated Vav2–/– mice), 14 (vagotomized WT), 17 (vagotomized Vav3–/– mice), and 5 (vagotomized Vav2–/– mice).
Figure 2
Figure 2. Vav3 deficiency–triggered RVLM hyperactivation requires vagal function
(A) Scheme (left) and representative (right) coronal brainstem section showing functional areas (left) and the specificity of TH staining within the RVLM (right, encircled area). Amb, nucleus ambiguus; LPGi, lateral paragigantocellular nucleus; PY, pyramidal tract; Sp5I, spinal trigeminal nucleus interpolar. D, dorsal; V, ventral. Scale bar, 1 mm. (B) Representative immunohistochemical images showing TH+ cells within the RVLM of mice of indicated genotypes and experimental groups. Scale bar, 100 μm. (C) Quantification of the RVLM TH+ cells from experiments shown in (B). (D) Plasma catecholamine levels in mice of the indicated genotype, group and treatment. (E,F) Abundance of the indicated transcripts in liver (E) and BAT (F) extracts from mice of indicated genotypes and experimental groups. Data shown in panels C–F represent mean ± SEM. *, P ≤ 0.05; **, P ≤ 0.01; ***, P ≤ 0.001 relative to either sham operated WT (black asterisks) or the sham operated animals of the same genotype group (red and green asterisks). ANOVA and Kruskal–Wallis tests were used for data obtained in panels (C,E,F) and (D), respectively. n = 6 (sham operated WT mice), 7 (sham operated WT + bicuculline), 6 (sham operated Vav3–/– mice with and without bicuculine), 7 (vagotomized WT with and without bicuculline), 8 (vagotomized Vav3–/– mice), 9 (vagotomized Vav3–/– mice + bicuculline), and 5 (sham operated and vagotomized Vav2–/– mice).
Figure 3
Figure 3. Vagal afferent fibers maintain RVLM–driven sympathoexcitation in Vav3–/– mice
(A) Representative immunohistochemical images showing TH+ cells within the RVLM of mice of indicated genotypes and experimental groups. Scale bar, 100 μm. (B) Quantification of the RVLM TH+ cells from experiments shown in (A). (C,D) Plasma adrenaline (C) and noradrenaline (D) levels in mice of indicated genotypes and experimental groups. (E–H) Quantification of plasma cortisol (E,G) and corticosterone (F,H) levels in mice of indicated genotypes and experimental groups. Data shown in panels B–H represent mean ± SEM. *, P ≤ 0.05; **, P ≤ 0.01; ***, P ≤ 0.001 relative to either sham operated WT (black asterisks) or the sham operated animals of the same genotype group (red and green asterisks) ANOVA, Kruskal–Wallis, and Mann–Whitney U tests were used for data obtained in panels (B), (C,D), and (E–H), respectively. n = 5 (sham operated WT mice), 6 (sham operated WT mice + bicuculline), 5 (sham operated Vav3–/– mice), 6 (sham operated Vav3–/– mice + bicuculline, vagotomized WT with and without bicuculline), 7 (vagotomized Vav3–/– mice), 8 (vagotomized Vav3–/– mice + bicuculline), 5 (sham operated Vav2–/– mice), and 6 (vagotomized Vav2–/– mice) (panels B–F). n = 13 (sham operated WT mice), 12 (sham operated Vav3–/– mice), 5 (sham operated Vav2–/– mice), 14 (vagotomized WT mice), 17 (vagotomized Vav3–/– mice), and 5 (vagotomized Vav2–/– mice) (panels G–H).
Figure 4
Figure 4. Afferent vagal fibers contribute to SNS–driven dysfunctions in Vav3–/– mice
(A–C) Mean arterial pressure (A), heart frequency (B), and breathing ratio (C) of mice of the indicated genotypes (inset) and experimental conditions (bottom). (D) Glucose tolerance test of the animals of the indicated genotypes and experimental groups. (E) Area under the curve values for the experiments shown in (D). (F) Quantification of triglycerides in liver extracts from mice of the indicated genotypes and experimental groups. (G,H) Abundance of the indicated transcripts in liver (G) and WAT (H) extracts from mice of the indicated genotypes and experimental groups. Bic, bicuculline. (I) Representative histological images of interscapular BAT sections from mice of indicated genotypes and experimental groups. Scale bar = 100 μm. (J) Quantification of the number of brown adipocytes per field in interscapular BAT from experiments shown in (I). (K) Abundance of the indicated transcripts in BAT extracts from mice of the indicated genotypes and experimental groups. WT–S, sham operated WT mice; WT–AV, WT mice with afferent vagotomy; V3–S, sham operated Vav3–/– mice; Vav3–AV, Vav3–/– mice with afferent vagotomy. (L) Summary of the results obtained in this work. Stimulatory and inhibitory connections are depicted as arrows and blunted lines, respectively. Data shown in panels A–H, J and K represent mean ± SEM. *, P ≤ 0.05; **, P ≤ 0.01; ***, P ≤ 0.001 relative to either sham operated WT (black asterisks) or the sham operated animals of the same genotype group (red and green asterisks). Student’s t, ANOVA, and Mann–Whitney U tests were used for data obtained in panels (A–E,J), (G), and (F,H,K), respectively. n = 11 (sham operated WT mice), 11 (sham operated Vav3–/– mice), 5 (sham operated Vav2–/– mice), 12 (vagotomized WT mice), 15 (vagotomized Vav3–/– mice), 6 (vagotomized Vav2–/– mice).

References

    1. Arner P, Gunnarsson R, Blomdahl S, Groth CG. Some characteristics of steroid diabetes: a study in renal-transplant recipients receiving high-dose corticosteroid therapy. Diabetes Care. 1983;6:23–25. - PubMed
    1. Benthem L, Keizer K, Wiegman CH, de Boer SF, Strubbe JH, Steffens AB, Kuipers F, Scheurink AJ. Excess portal venous long-chain fatty acids induce syndrome X via HPA axis and sympathetic activation. Am J Physiol Endocrinol Metab. 2000;279:E1286–1293. - PubMed
    1. Bernal-Mizrachi C, Weng S, Feng C, Finck BN, Knutsen RH, Leone TC, Coleman T, Mecham RP, Kelly DP, Semenkovich CF. Dexamethasone induction of hypertension and diabetes is PPAR-alpha dependent in LDL receptor-null mice. Nat Med. 2003;9:1069–1075. - PubMed
    1. Bernal-Mizrachi C, Xiaozhong L, Yin L, Knutsen RH, Howard MJ, Arends JJ, Desantis P, Coleman T, Semenkovich CF. An afferent vagal nerve pathway links hepatic PPARalpha activation to glucocorticoid-induced insulin resistance and hypertension. Cell Metab. 2007;5:91–102. - PMC - PubMed
    1. Berthoud HR, Neuhuber WL. Functional and chemical anatomy of the afferent vagal system. Auton Neurosci. 2000;85:1–17. - PubMed

Publication types

MeSH terms

LinkOut - more resources