. 2019 Jan 31;13(1):e0007140.
doi: 10.1371/journal.pntd.0007140. eCollection 2019 Jan.

Growing evidence of Plasmodium vivax across malaria-endemic Africa

Affiliations

Growing evidence of Plasmodium vivax across malaria-endemic Africa

Katherine A Twohig et al. PLoS Negl Trop Dis. .

Erratum in

Abstract

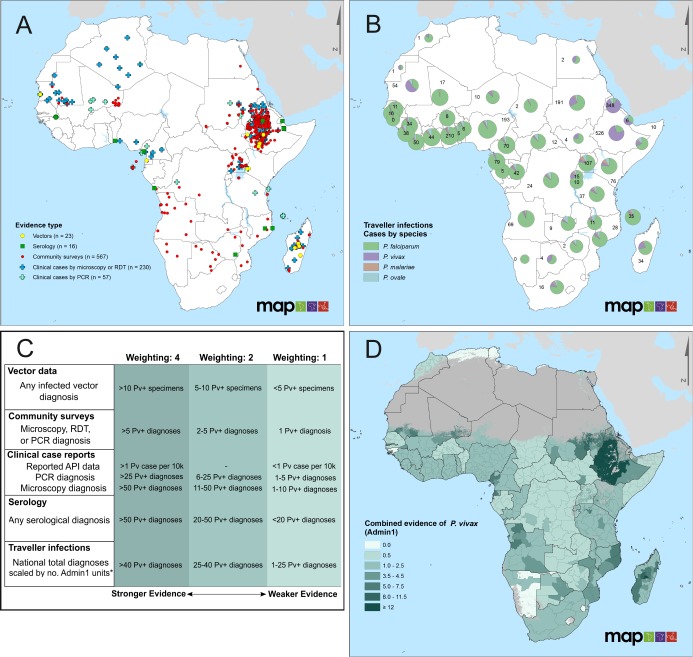
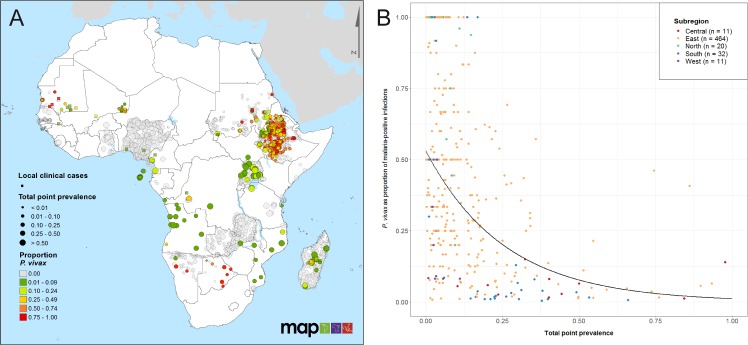
Effective malaria control strategies require an accurate understanding of the epidemiology of locally transmitted Plasmodium species. Compared to Plasmodium falciparum infection, Plasmodium vivax has a lower asexual parasitaemia, forms dormant liver-stages (hypnozoites), and is more transmissible. Hence, treatment and diagnostic policies aimed exclusively at P. falciparum are far less efficient against endemic P. vivax. Within sub-Saharan Africa, malaria control programmes justly focus on reducing the morbidity and mortality associated with P. falciparum. However, the recent emphasis on malaria elimination and increased accessibility of more sensitive diagnostic tools have revealed greater intricacies in malaria epidemiology across the continent. Since 2010, the number of studies identifying P. vivax endemic to Africa has expanded considerably, with 88 new scientific reports published since a review of evidence in 2015, approximately doubling the available data. There is evidence of P. vivax in all regions of Africa, apparent from infected vectors, clinical cases, serological indicators, parasite prevalence, exported infections, and P. vivax-infected Duffy-negative individuals. Where the prevalence of microscopic parasitaemia is low, a greater proportion of P. vivax infections were observed relative to P. falciparum. This evidence highlights an underlying widespread presence of P. vivax across all malaria-endemic regions of Africa, further complicating the current practical understanding of malaria epidemiology in this region. Thus, ultimate elimination of malaria in Africa will require national malaria control programmes to adopt policy and practice aimed at all human species of malaria.


Conflict of interest statement

The authors have declared that no competing interests exist.

Figures

Fig 1
Fig 1. Evidence of P. vivax in Africa.
Panel A maps all available reports of P. vivax occurrence (n = 657 unique sites) by evidence type (1980–2016). Data from Howes et al. [14] are combined with the results of this update (new points are shown in S4 Fig). Panel B summarises exported malaria infections among travellers returning to non-endemic countries, grouped by suspected country of origin and Plasmodium species. Pie charts represent the proportional contribution by malaria species, sized based on a log-transformation of the total number of infections. The numbers shown beside each pie chart refer to the number of P. vivax infection reports attributed to each country. The traveller infections database represents an opportunistic assembly of reports, and does not aim to be comprehensive; reports are aggregates of data from 1991 to 2016, see S3 Fig for timespan of input data. Panel C documents the framework used to weight the data from Panels A and B to characterise the strength of evidence of local P. vivax transmission. Evidence weights (top row) were assigned for each evidence type in each Admin1 unit (state/province), and summed to indicate the total evidence of P. vivax in a given unit. The resulting composite evidence map is shown in Panel D. Darker shading indicates increased evidence of the presence of P. vivax. White indicates units for which no evidence was found (evidence strength = 0), and grey shading indicates regions where environmental conditions are unsuitable for P. vivax transmission [22]. *National reported infections among returning travellers were scaled by the total number of Admin1 units in a given country. For countries with fewer traveller P. vivax cases than Admin1 units, a weighting of 0.5 was given to each admin unit.
Fig 2
Fig 2. Relationship between proportion of infections due to P. vivax and total malaria prevalence across Africa.
Panel A shows the spatial distribution of the proportion of P. vivax infections relative to P. falciparum, based on a subset of sources from the final database that tested for both P. vivax and P. falciparum, and employed representative sampling methods. Prevalence points (round dots, total n = 3,329; n = 565 with P. vivax proportion > 0) are coloured according to the proportion of infections due to P. vivax, and sized according to the total point prevalence at each site. Clinical case reports where the species proportion could be determined are represented as squares (n = 152) and also coloured by P. vivax proportion. S6 Fig shows the equivalent map with points sized by sample size. Panel B plots site-wise proportion of infections due to P. vivax (y-axis) in relation to overall community prevalence (x-axis) at locations where the total number examined was at least 30 individuals and at least one P. vivax infection was detected (n = 538). Only surveys that used diagnostic methods sensitive to both P. vivax and P. falciparum were included. Points are coloured according to African Union regions (S1 Fig) [47], with trend lines added as a visual guide.
Fig 3
Fig 3. Plasmodium vivax positivity in Duffy-negative individuals in Africa.
Panel A summarises proportions of detected P. vivax infections among individuals who are Duffy-negative (orange) relative to those who are Duffy-positive (blue), by site. Different shades of orange distinguish symptomatic (clinic-based studies; dark orange) and asymptomatic (community studies; light orange) P. vivax infections in Duffy-negative individuals. Pie charts are sized relative to the total individuals tested for both P. vivax and Duffy status, with numbers corresponding to the total numbers of P. vivax infections of Duffy negative hosts. Grey shading illustrates areas in Africa with environmental conditions unsuitable for P. vivax transmission [22]. Panel B plots the odds ratios (OR) of P. vivax infection among Duffy-negative vs Duffy-positive individuals, in a subset of surveys that reported the Duffy phenotype and P. vivax infection status for all individuals, and where P. vivax infections were observed in both Duffy phenotypes. Infection counts were summed from all locations in each study.

References

    1. Cibulskis RE, Alonso P, Aponte J, Aregawi M, Barrette A, Bergeron L, et al. Malaria: Global progress 2000–2015 and future challenges. Infect Dis Poverty. 2016;5:61 10.1186/s40249-016-0151-8 PMC4901420. - DOI - PMC - PubMed
    1. Bhatt S, Weiss DJ, Cameron E, Bisanzio D, Mappin B, Dalrymple U, et al. The effect of malaria control on Plasmodium falciparum in Africa between 2000 and 2015. Nature. 2015;526:207 10.1038/nature15535 https://www.nature.com/articles/nature15535#supplementary-information. - DOI - PMC - PubMed
    1. Cohen JM, Smith DL, Cotter C, Ward A, Yamey G, Sabot OJ, et al. Malaria resurgence: a systematic review and assessment of its causes. Malar J. 2012;11(1):122 10.1186/1475-2875-11-122 - DOI - PMC - PubMed
    1. Nájera JA, González-Silva M, Alonso PL. Some lessons for the future from the Global Malaria Eradication Programme (1955–1969). PLoS Med. 2011;8(1):e1000412 10.1371/journal.pmed.1000412 - DOI - PMC - PubMed
    1. WHO. World Malaria Report 2017 Geneva, Switzerland: World Health Organization, 2017.

Publication types

MeSH terms

Substances