

Individual response to mTOR inhibition in delaying replicative senescence of mesenchymal stromal cells
- PMID: 30703123
- PMCID: PMC6354956
- DOI: 10.1371/journal.pone.0204784
Individual response to mTOR inhibition in delaying replicative senescence of mesenchymal stromal cells
Abstract
Background aims: Delaying replicative senescence and extending lifespan of human mesenchymal stromal cells (MSCs) may enhance their potential for tissue engineering and cell based therapies. Accumulating evidence suggests that inhibitors of the mTOR signaling pathway, such as rapamycin, constitute promising pharmacological agents to retard senescence and extend stemness properties of various progenitor cell types. Here, we investigated whether the ability of rapamycin to postpone replicative senescence varies among bone marrow MSC samples (BM-MSCs) derived from different healthy donors, and explored the molecular mechanisms that drive rapamycin-mediated lifespan increment.
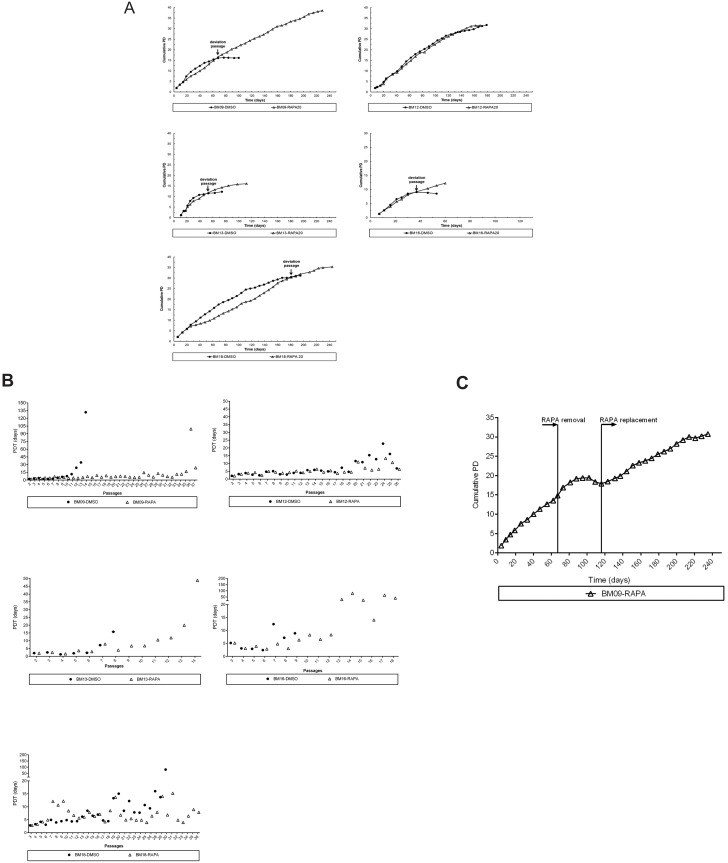
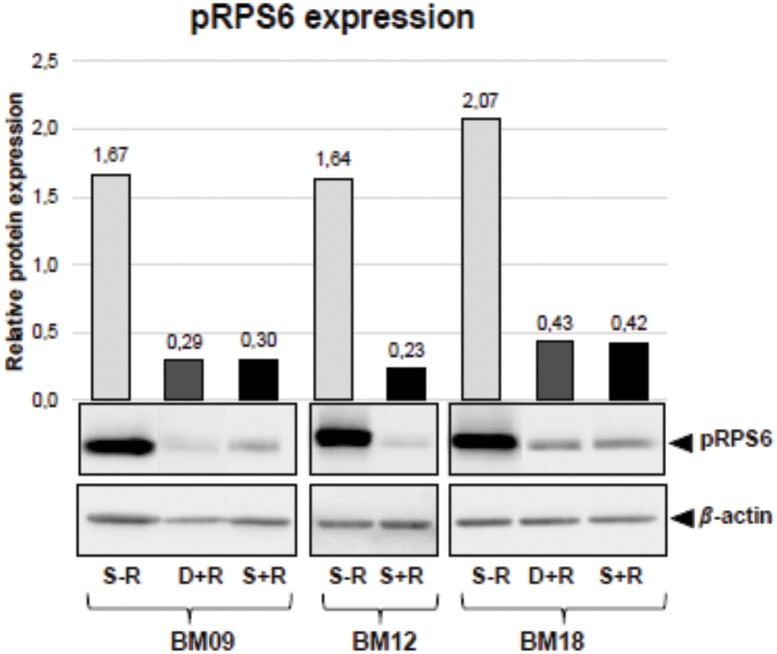
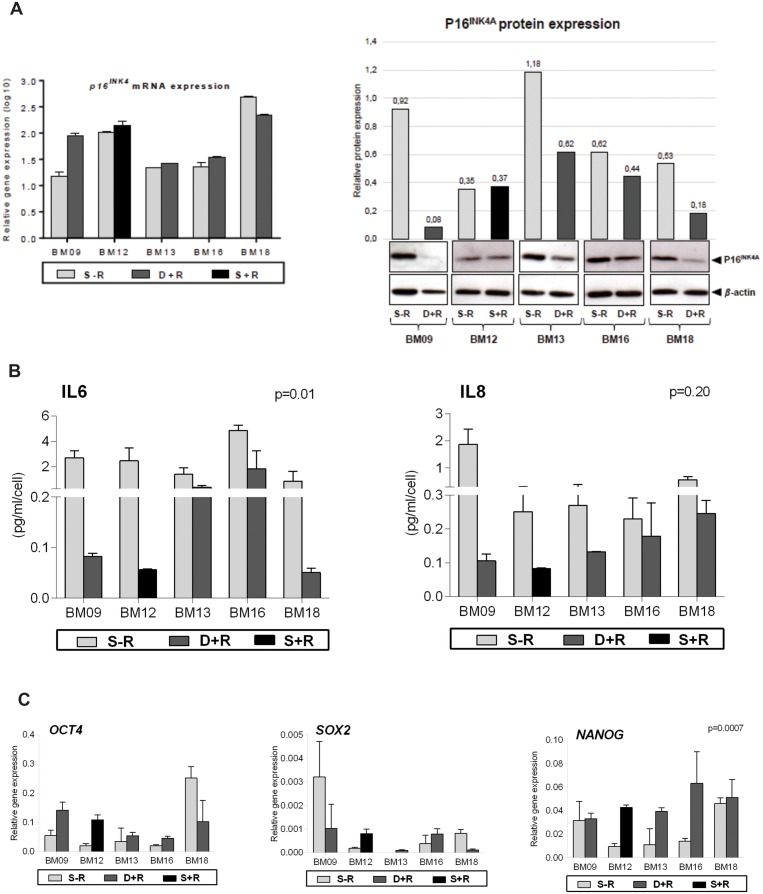
Methods: BM-MSCs at early passages were serially passaged either in absence or continuous presence of rapamycin and the number of cell population doublings until growth arrest was measured. The inhibition of mTOR signaling was assessed by the phosphorylation status of the downstream target RPS6. The expression levels of several senescence and pluripotency markers at early and late/senescent passages were analyzed by RT-qPCR, flow cytometry and western blot.
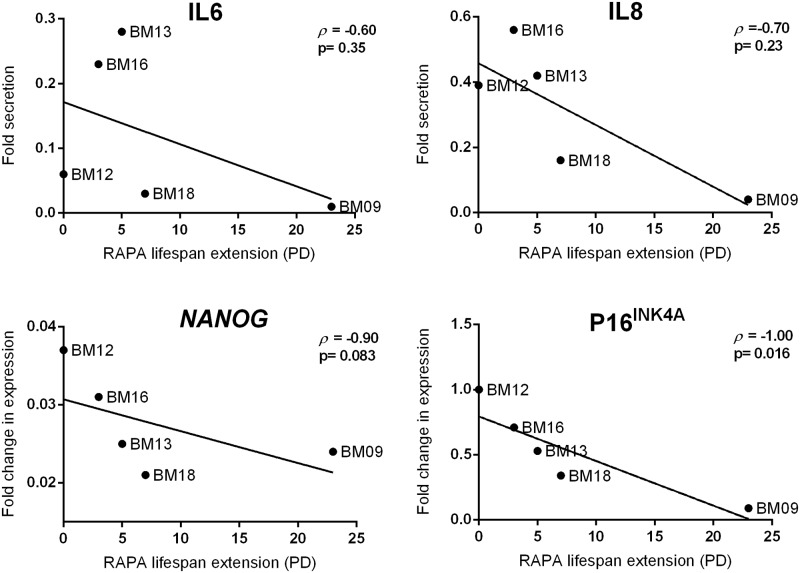
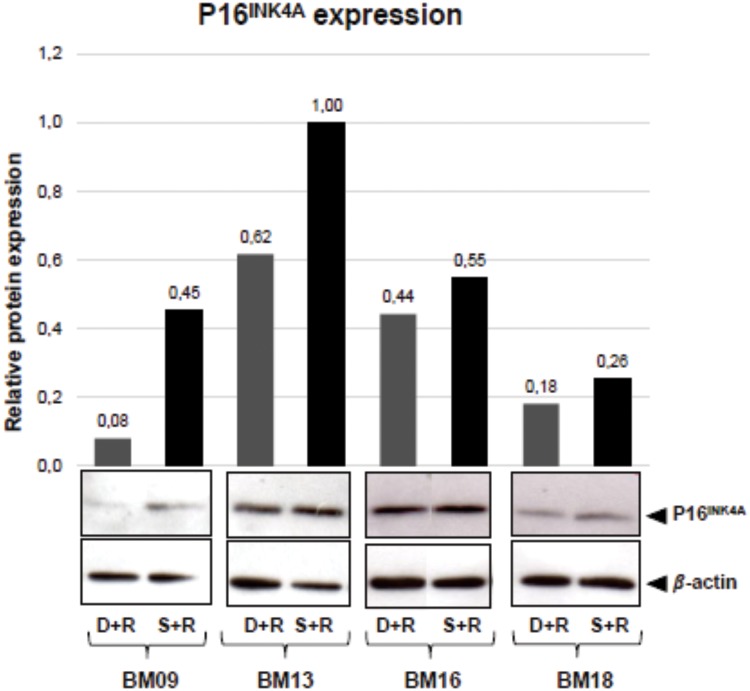
Results: We found that the lifespan extension in response to the continuous rapamycin treatment was highly variable among samples, but effective in most BM-MSCs. Despite all rapamycin-treated cells secreted significantly reduced levels of IL6, a major SASP cytokine, and expressed significantly higher levels of the pluripotency marker NANOG, the expression patterns of these markers were not correlated with the rapamycin-mediated increase in lifespan. Interestingly, rapamycin-mediated life-span extension was significantly associated only with repression of p16INK4A protein accumulation.
Conclusions: Taken together, our results suggest that some, but not all, BM-MSC samples would benefit from using rapamycin to postpone replicative arrest and reinforce a critical role of p16INK4A protein downregulation in this process.
Conflict of interest statement
The authors have declared that no competing interests exist.
Figures
Similar articles
-
Endothelial replicative senescence delayed by the inhibition of MTORC1 signaling involves MicroRNA-107.Int J Biochem Cell Biol. 2018 Aug;101:64-73. doi: 10.1016/j.biocel.2018.05.016. Epub 2018 May 29. Int J Biochem Cell Biol. 2018. PMID: 29857052
-
Rapamycin inhibits the secretory phenotype of senescent cells by a Nrf2-independent mechanism.Aging Cell. 2017 Jun;16(3):564-574. doi: 10.1111/acel.12587. Epub 2017 Mar 31. Aging Cell. 2017. PMID: 28371119 Free PMC article.
-
Rapamycin reverses the senescent phenotype and improves immunoregulation of mesenchymal stem cells from MRL/lpr mice and systemic lupus erythematosus patients through inhibition of the mTOR signaling pathway.Aging (Albany NY). 2016 May;8(5):1102-14. doi: 10.18632/aging.100925. Aging (Albany NY). 2016. PMID: 27048648 Free PMC article.
-
Rapamycin and the inhibition of the secretory phenotype.Exp Gerontol. 2017 Aug;94:89-92. doi: 10.1016/j.exger.2017.01.026. Epub 2017 Feb 4. Exp Gerontol. 2017. PMID: 28167236 Review.
-
mTOR Activity and Autophagy in Senescent Cells, a Complex Partnership.Int J Mol Sci. 2021 Jul 29;22(15):8149. doi: 10.3390/ijms22158149. Int J Mol Sci. 2021. PMID: 34360912 Free PMC article. Review.
Cited by
-
Human mesenchymal stem cells derived from adipose tissue showed a more robust effect than those from the umbilical cord in promoting corneal graft survival by suppressing lymphangiogenesis.Stem Cell Res Ther. 2023 Nov 14;14(1):328. doi: 10.1186/s13287-023-03559-2. Stem Cell Res Ther. 2023. PMID: 37957770 Free PMC article.
-
Short-Term Rapamycin Preconditioning Diminishes Therapeutic Efficacy of Human Adipose-Derived Stem Cells in a Murine Model of Multiple Sclerosis.Cells. 2020 Sep 30;9(10):2218. doi: 10.3390/cells9102218. Cells. 2020. PMID: 33008073 Free PMC article.
-
Aging of mesenchymal stem cell: machinery, markers, and strategies of fighting.Cell Mol Biol Lett. 2022 Aug 19;27(1):69. doi: 10.1186/s11658-022-00366-0. Cell Mol Biol Lett. 2022. PMID: 35986247 Free PMC article. Review.
-
Cellular Senescence in the Kidney.J Am Soc Nephrol. 2019 May;30(5):726-736. doi: 10.1681/ASN.2018121251. Epub 2019 Apr 18. J Am Soc Nephrol. 2019. PMID: 31000567 Free PMC article. Review.
-
Immunomodulating Profile of Dental Mesenchymal Stromal Cells: A Comprehensive Overview.Front Oral Health. 2021 Mar 31;2:635055. doi: 10.3389/froh.2021.635055. eCollection 2021. Front Oral Health. 2021. PMID: 35047993 Free PMC article.
References
Publication types
MeSH terms
Substances
LinkOut - more resources
Full Text Sources
Research Materials
Miscellaneous
