. 2019 Jan 30;19(3):584.
doi: 10.3390/s19030584.

Limits of the Effective Medium Theory in Particle Amplified Surface Plasmon Resonance Spectroscopy Biosensors

Affiliations

Limits of the Effective Medium Theory in Particle Amplified Surface Plasmon Resonance Spectroscopy Biosensors

Jefferson S Costa et al. Sensors (Basel). .

Abstract

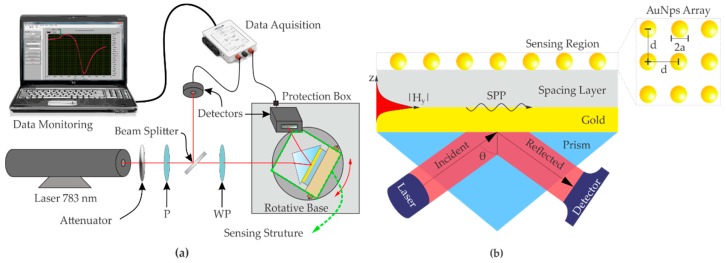
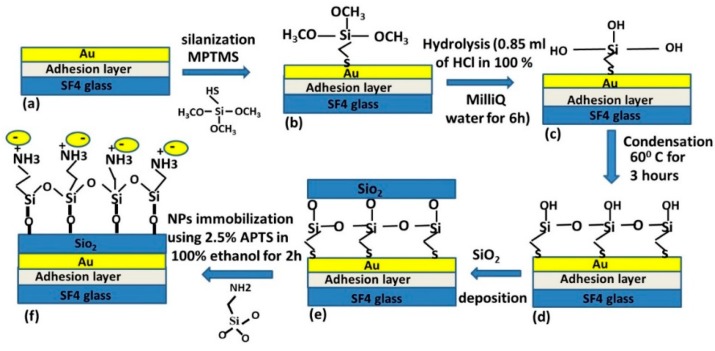
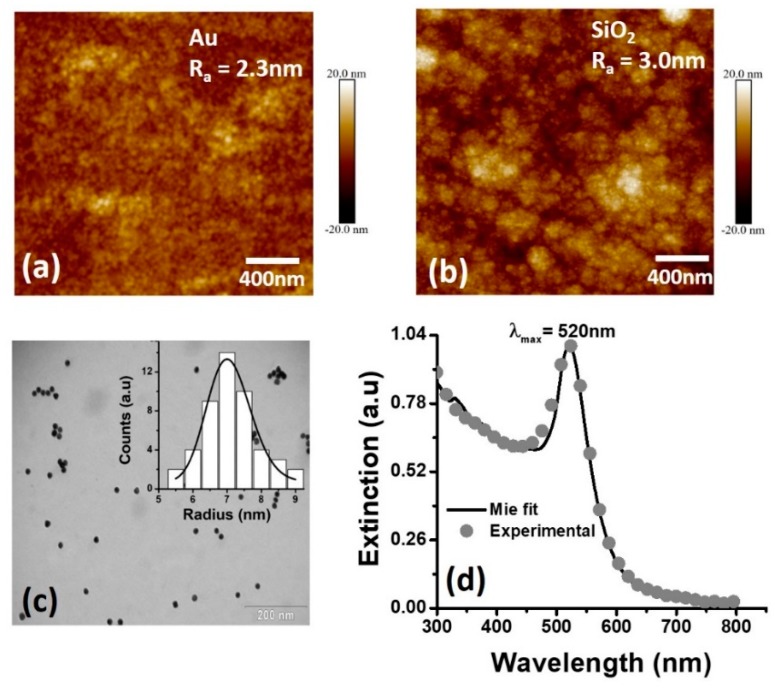
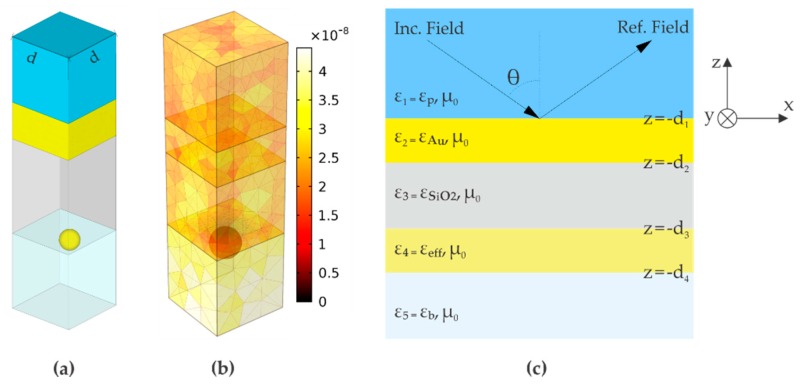
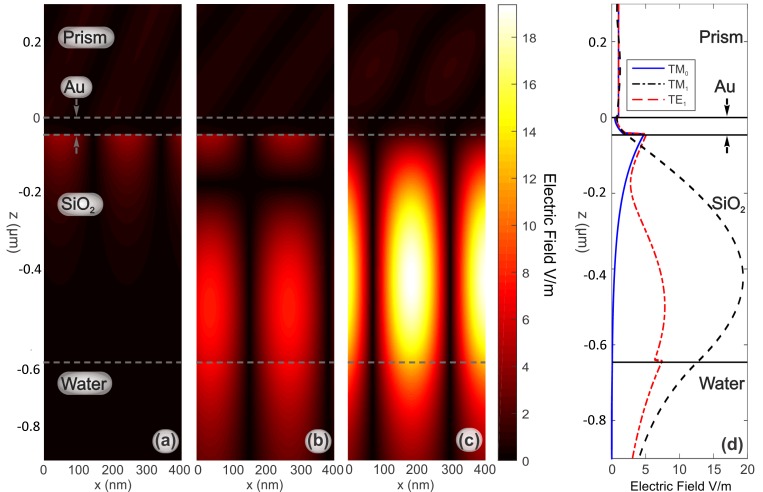
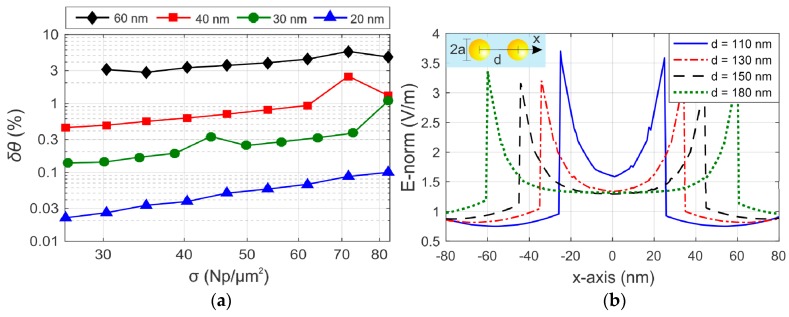
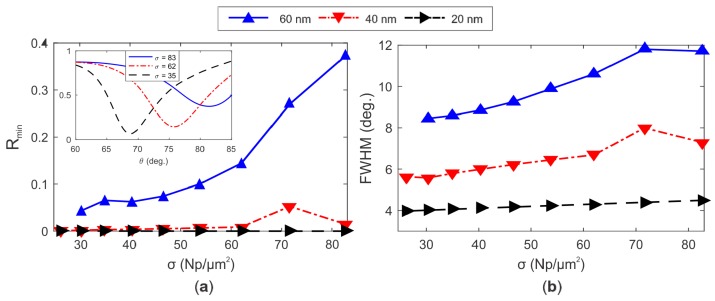
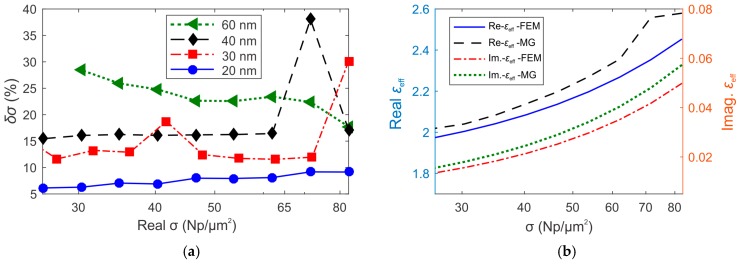
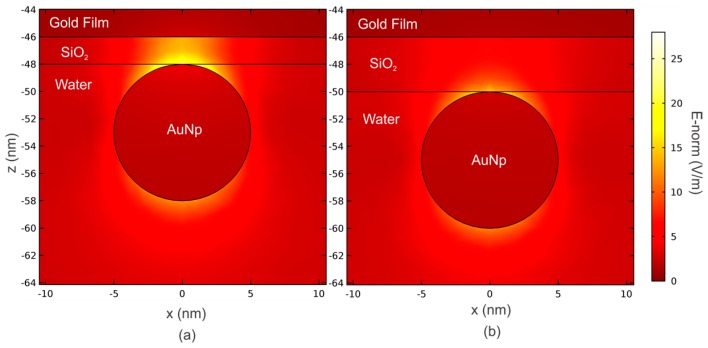
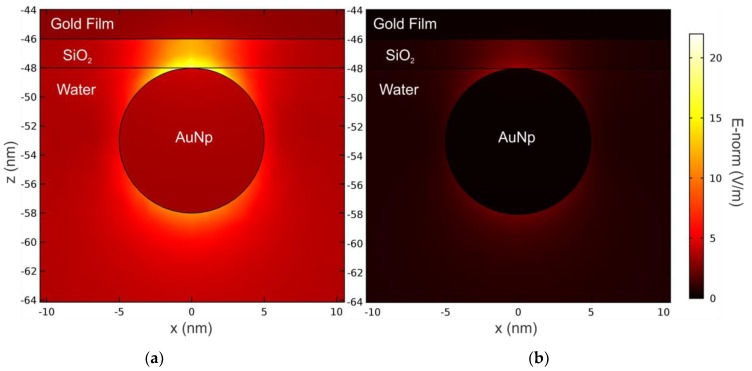
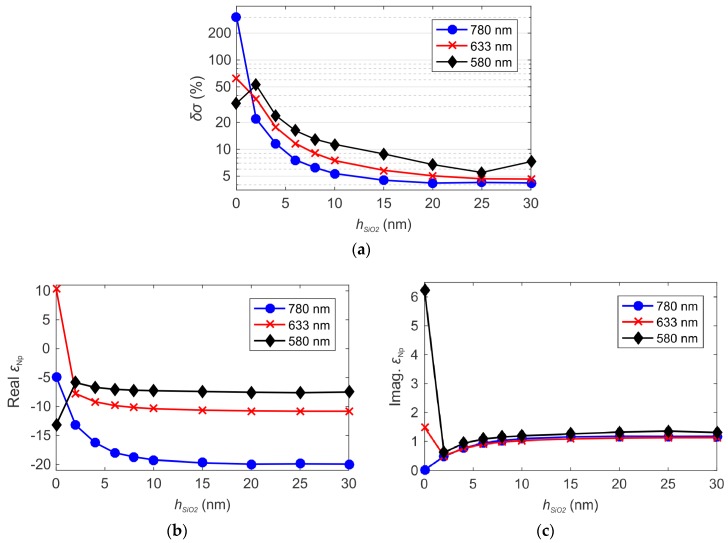
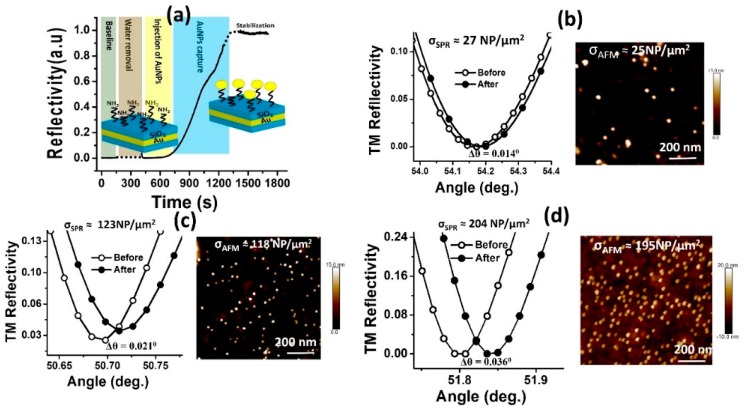
The resonant wave modes in monomodal and multimodal planar Surface Plasmon Resonance (SPR) sensors and their response to a bidimensional array of gold nanoparticles (AuNPs) are analyzed both theoretically and experimentally, to investigate the parameters that rule the correct nanoparticle counting in the emerging metal nanoparticle-amplified surface plasmon resonance (PA-SPR) spectroscopy. With numerical simulations based on the Finite Element Method (FEM), we evaluate the error performed in the determination of the surface density of nanoparticles σ when the Maxwell-Garnett effective medium theory is used for fast data processing of the SPR reflectivity curves upon nanoparticle detection. The deviation increases directly with the manifestations of non-negligible scattering cross-section of the single nanoparticle, dipole-dipole interactions between adjacent AuNPs and dipolar interactions with the metal substrate. Near field simulations show clearly the set-up of dipolar interactions when the dielectric thickness is smaller than 10 nm and confirm that the anomalous dispersion usually observed experimentally is due to the failure of the effective medium theories. Using citrate stabilized AuNPs with a nominal diameter of about 15 nm, we demonstrate experimentally that Dielectric Loaded Waveguides (DLWGs) can be used as accurate nanocounters in the range of surface density between 20 and 200 NP/µm², opening the way to the use of PA-SPR spectroscopy on systems mimicking the physiological cell membranes on SiO₂ supports.

Keywords: Atomic Force Microscopy (AFM); Dielectric Loaded Waveguide (DLWG); Finite Element Method (FEM); Maxwell-Garnett effective medium theory; Particle Amplified Surface Plasmon Resonance Spectroscopy (PA-SPR).


Conflict of interest statement

The authors declare no conflict of interest.

Figures

Figure 1
Figure 1
(a) Illustration of the experimental SPR set-up in Kreschtmann configuration. P: linear polarizer. WP: λ/4 wave-plate. (b) The sensing structure is composed of a coupling prism, a thin film of gold (~ 50 nm) and a dielectric spacer layer (SiO2).
Figure 2
Figure 2
Schematic diagram showing the fabrication of the DLWGs. (a) 49 nm gold thin film deposited on clean SF4 glass. (b) Silanization with MPTS. (c) Hydrolysis process: methoxy groups are converted to Si-OH group. (d) Condensation leads to Si-O-Si network. (e) Deposition of SiO2 and (f) modification of SiO2 with amino group’s (-NH2) of APTS, which serves as molecular link for the negative charged citrate stabilized AuNPs.
Figure 3
Figure 3
(a) AFM morphology image of the 49 nm gold thin film and (b) the 670 nm SiO2 layer constituting the DLWGs used in the present work. (c) Typical TEM image of the citrate colloidal solution of AuNPs used in the optical sensing experiments. A log-normal distribution is used to obtain the best fit to the experimental statistical distribution, represented as continuous line in the inset. (d) Comparison between the experimental (grey circles) and theoretical (continuous black line) extinction spectra of the citrate colloidal dispersion of AuNPs. The fit on the experimental data was obtained applying the Mie theory with quadrupole orders [31].
Figure 4
Figure 4
(a) Unit periodic cell considered in the numerical simulations by the COMSOL® software. The Floquet theorem is used to set the periodic boundary conditions. Periodic ports are used in the top boundary (set on to simulate the incident planar wave) and in the bottom boundary (set off to simulate a very large layer) [18]; (b) Mesh of the FEM model of the sensor. Colors indicate the size of the elements, which is defined by physical and geometrical factors; (c) Resultant planar structure of the PA-SPR sensor in the effective layer approximation to represent the AuNPs periodic array.
Figure 5
Figure 5
Reflectivity curves R(θ) at the wavelength of 633 nm with increasing values of hSiO2 for both (a) TM and (b) TE polarizations. The arrows highlight the resonant wave mode for each minimum in R. The thickness of the gold thin film is hAu = 46 nm and the external medium is water.
Figure 6
Figure 6
The absolute values of the electric field for the resonant modes in the SPR platform. In colors for a cut plane parallel to the zx-plane: (a) Ez Field for TM0 mode with θ = 66.9°, (b) Ez field for TM1 mode with θ = 51.88°, and (c) Ey field for TE1 mode with θ = 53.57°; (d) Norm of E field for the resonant modes in a cut line parallel to the z-axis. Fixed parameters: λ = 633 nm, hAu = 46 nm, and hSiO2 = 600 nm.
Figure 7
Figure 7
Bulk sensitivity S of the Au/SiO2 sensing platforms versus hSiO2 for variation of the external refractive index from 1.33 to 1.36 RIU. Both plasmonic and DLWG regimes in TM and TE polarizations are considered.
Figure 8
Figure 8
(a) Relative deviation δθ between the resonance angles θFEM and θMG relative to an Au/SiO2 monomodal sensing platform with a dielectric thickness of 50 nm. The data are represented for AuNPs diameters of 20, 30, 40 and 60 nm, and surface densities σ between 26 and 83 Np/µm2. (b) Ez field between two adjacent AuNPs with the diameter of 60 nm embedded in water. The centers of the AuNPs are separated by the distance d, as highlighted in the inset.
Figure 9
Figure 9
(a) Rmin and (b) FWHM of the reflectivity SPR spectra calculated by FEM for AuNPs with diameters of 60 nm, 40 nm, and 20 nm, and surface density in the range of 26 < σ < 83 Np/µm2. In (a), the inset highlights the reflectivity curves for 60 nm sized AuNPs and surface densities σ of 83, 62 and 35 Np/µm2.
Figure 10
Figure 10
(a) The relative deviation δσ between the real surface density σFEM and the density σMG calculated applying the MG formula to fit the resonance angle θFEM. (b) Comparison between the effective permittivity of the Au/water composite layer calculated using the MG mixing formula (MG-εeff) and the correct real values obtained by FEM method (FEM-εeff). The comparison has been performed considering AuNPs with a diameter of 40 nm.
Figure 11
Figure 11
Norm of the near electric field surrounding the AuNPs for thin dielectric spacer layers: (a) hSiO2 = 2 nm and (b) hSiO2 = 4 nm. The parameters are λ = 633 nm, hAu = 46 nm, a = 5 nm, σ = 40 Np/µm2, and θ = 60°.
Figure 12
Figure 12
Norm of the near electric field surrounding an AuNP for a thin dielectric spacer layer with a thickness of 2 nm, calculated at the wavelengths of (a) 633 nm and (b) 783 nm. Fixed parameters: hAu = 46 nm, 2a = 10 nm, σ = 40 NP/µm2, and θ = 60°.
Figure 13
Figure 13
(a) Relative percentage deviation δσ between the real surface density σFEM and the density σMG calculated using the MG theory to fit the TM0 resonance angle θFEM. Real (b) and imaginary (c) parts of the dielectric constant of the AuNPs (εNp) calculated by the MG theory in order to fit the exact reflectivity curves calculated by the FEM method. The results are shown in function of hSiO2 and for the excitation wavelengths of 580 nm, 633 nm and 780 nm. Fixed parameters: hAu = 46 nm, 2a = 10 nm and σ ≈ 40 NP/µm2.
Figure 14
Figure 14
Principle of work of SPR nanoparticle counting with DLWGs. (a) SPR sensorgram relative to the sensing of the interaction between the amino group NH2+ of the external surface of the DLWGs and the negatively charged AuNPs. The TM1 mode of the DLWG has been used as evanescent optical probe. The excitation wavelength was 783 nm, and the sensorgram was taken at a fixed incidence angle of 50.695°. (b) Comparison between experimental σSPR and σAFM in the non-interacting surface density regime: experimental SPR reflectivity curve of the TM1 mode of the DLWGs in water before and after interaction of the AuNPs with the SiO2 surface (left side), and AFM image of a 1 µm × 1 µm region of the SiO2 surface of the device analyzed by SPR spectroscopy (right size), with a surface density of 25 NP/µm2. (c) σ = 120 NP/µm2. (d) σ = 200 NP/µm2. The average surface density σAFM was calculated by analysis of four different regions of each sample.

Similar articles

Cited by

References

    1. Homola J. Surface plasmon resonance sensors for detection of chemical and biological species. Chem. Rev. 2008;108:462–493. doi: 10.1021/cr068107d. - DOI - PubMed
    1. Homola J. Surface Plasmon Resonance Based Sensors. In: Wolfbeis O.S., editor. Springer Series on Chemical Sensors and Biosensors. Volume 4. Springer; Berlin/Heidelberg, Germany: New York, NY, USA: 2006.
    1. Nenninger G.G., Piliarik M., Homola J. Data analysis for optical sensors based on spectroscopy of surface plasmons. J. Meas. Sci. Technol. 2002;13 doi: 10.1088/0957-0233/13/12/332. - DOI
    1. O’Brien M.J., Pérez-Luna V.H., Brueck S.R.J., López G.P. A surface plasmon resonance array biosensor based on spectroscopic imaging. Biosens. Bioelectron. 2001;16:97–108. doi: 10.1016/S0956-5663(00)00137-8. - DOI - PubMed
    1. Ng S., Loo F., Wu S., Kong S., Wu C., Ho H. Common-path spectral interferometry with temporal carrier for highly sensitive surface plasmon resonance sensing. Opt. Express. 2013;21:20268–20273. doi: 10.1364/OE.21.020268. - DOI - PubMed

MeSH terms

LinkOut - more resources