

Scaling up prevention and treatment towards the elimination of hepatitis C: a global mathematical model
- PMID: 30704789
- PMCID: PMC6484702
- DOI: 10.1016/S0140-6736(18)32277-3
Scaling up prevention and treatment towards the elimination of hepatitis C: a global mathematical model
Abstract
Background: The revolution in hepatitis C virus (HCV) treatment through the development of direct-acting antivirals (DAAs) has generated international interest in the global elimination of the disease as a public health threat. In 2017, this led WHO to establish elimination targets for 2030. We evaluated the impact of public health interventions on the global HCV epidemic and investigated whether WHO's elimination targets could be met.
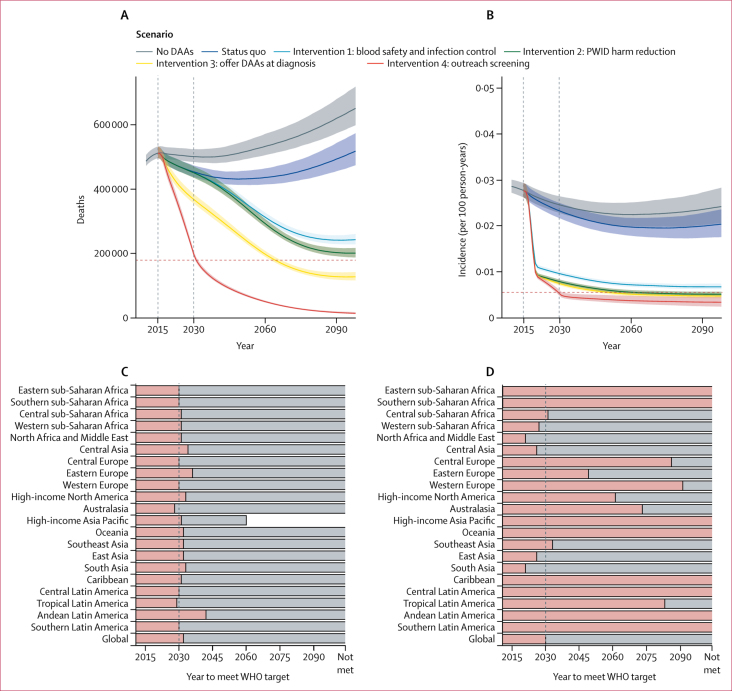
Methods: We developed a dynamic transmission model of the global HCV epidemic, calibrated to 190 countries, which incorporates data on demography, people who inject drugs (PWID), current coverage of treatment and prevention programmes, natural history of the disease, HCV prevalence, and HCV-attributable mortality. We estimated the worldwide impact of scaling up interventions that reduce risk of transmission, improve access to treatment, and increase screening for HCV infection by considering six scenarios: no change made to existing levels of diagnosis or treatment; sequentially adding the following interventions: blood safety and infection control, PWID harm reduction, offering of DAAs at diagnosis, and outreach screening to increase the number diagnosed; and a scenario in which DAAs are not introduced (ie, treatment is only with pegylated interferon and oral ribavirin) to investigate the effect of DAA use. We explored the effect of varying the coverage or impact of these interventions in sensitivity analyses and also assessed the impact on the global epidemic of removing certain key countries from the package of interventions.
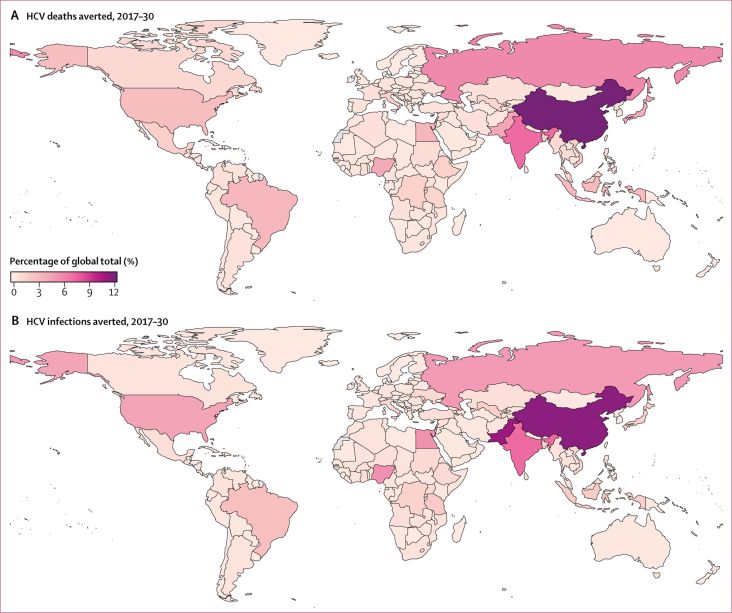
Findings: By 2030, interventions that reduce risk of transmission in the non-PWID population by 80% and increase coverage of harm reduction services to 40% of PWID could avert 14·1 million (95% credible interval 13·0-15·2) new infections. Offering DAAs at time of diagnosis in all countries could prevent 640 000 deaths (620 000-670 000) from cirrhosis and liver cancer. A comprehensive package of prevention, screening, and treatment interventions could avert 15·1 million (13·8-16·1) new infections and 1·5 million (1·4-1·6) cirrhosis and liver cancer deaths, corresponding to an 81% (78-82) reduction in incidence and a 61% (60-62) reduction in mortality compared with 2015 baseline. This reaches the WHO HCV incidence reduction target of 80% but is just short of the mortality reduction target of 65%, which could be reached by 2032. Reducing global burden depends upon success of prevention interventions, implemention of outreach screening, and progress made in key high-burden countries including China, India, and Pakistan.
Interpretation: Further improvements in blood safety and infection control, expansion or creation of PWID harm reduction services, and extensive screening for HCV with concomitant treatment for all are necessary to reduce the burden of HCV. These findings should inform the ongoing global action to eliminate the HCV epidemic.
Funding: Wellcome Trust.
Copyright © 2019 The Author(s). Published by Elsevier Ltd. This is an Open Access article under the CC BY 4.0 license. Published by Elsevier Ltd.. All rights reserved.
Figures


Comment in
-
How feasible is the global elimination of HCV infection?Lancet. 2019 Mar 30;393(10178):1265-1267. doi: 10.1016/S0140-6736(18)32750-8. Epub 2019 Jan 29. Lancet. 2019. PMID: 30704788 No abstract available.
References
-
- WHO . World Health Organization; Geneva: 2017. Global hepatitis report, 2017.
-
- Westbrook RH, Dusheiko G. Natural history of hepatitis C. J Hepatol. 2014;61:s58–s68. - PubMed
-
- Thein H-H, Yi Q, Dore GJ, Krahn MD. Estimation of stage-specific fibrosis progression rates in chronic hepatitis C virus infection: a meta-analysis and meta-regression. Hepatology. 2008;48:418–431. - PubMed
MeSH terms
Substances
Grants and funding
LinkOut - more resources
Full Text Sources
Other Literature Sources
Medical
Miscellaneous
