. 2019 Mar 6;101(5):863-875.e6.
doi: 10.1016/j.neuron.2019.01.002. Epub 2019 Jan 28.

A Photoactivatable Botulinum Neurotoxin for Inducible Control of Neurotransmission

Affiliations

A Photoactivatable Botulinum Neurotoxin for Inducible Control of Neurotransmission

Qi Liu et al. Neuron. .

Abstract

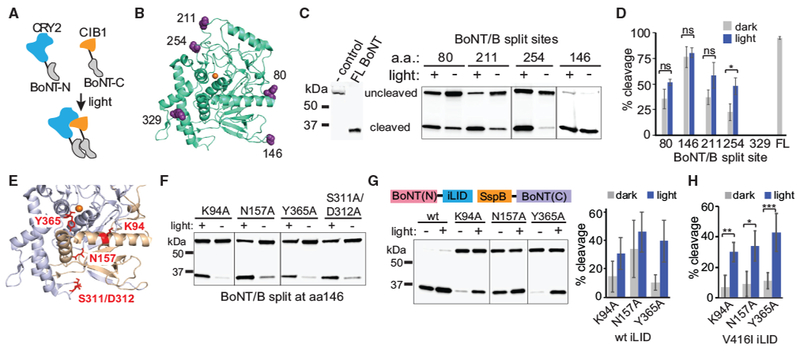
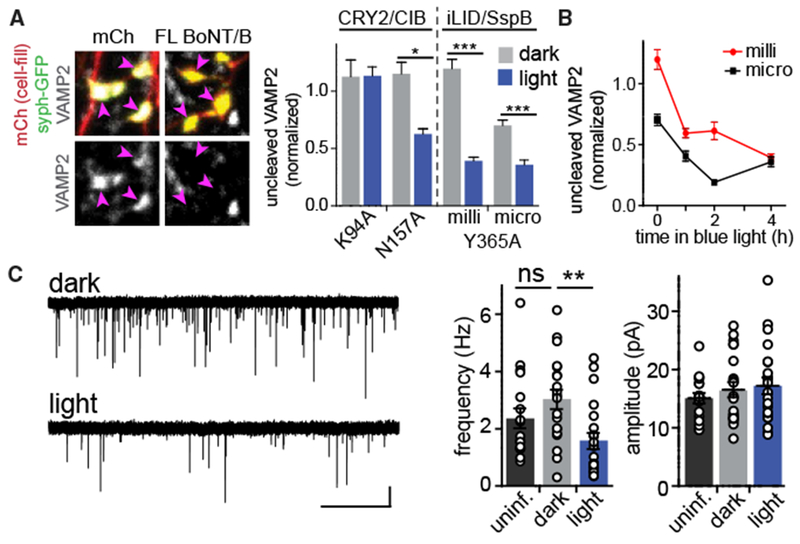
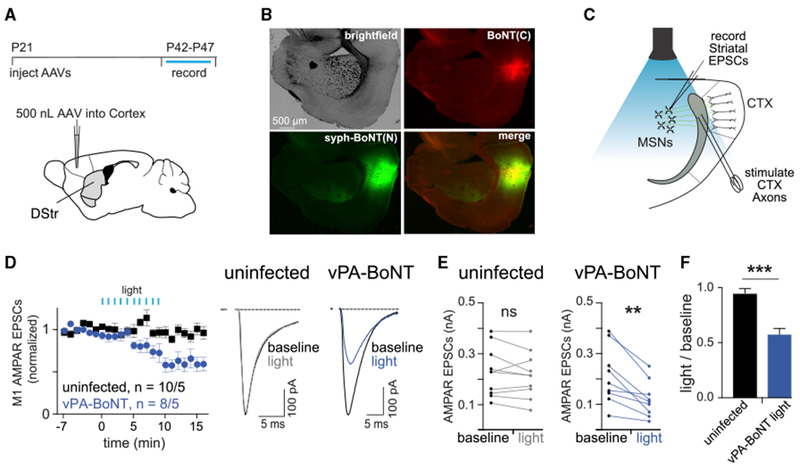
Regulated secretion is critical for diverse biological processes ranging from immune and endocrine signaling to synaptic transmission. Botulinum and tetanus neurotoxins, which specifically proteolyze vesicle fusion proteins involved in regulated secretion, have been widely used as experimental tools to block these processes. Genetic expression of these toxins in the nervous system has been a powerful approach for disrupting neurotransmitter release within defined circuitry, but their current utility in the brain and elsewhere remains limited by lack of spatial and temporal control. Here we engineered botulinum neurotoxin B so that it can be activated with blue light. We demonstrate the utility of this approach for inducibly disrupting excitatory neurotransmission, providing a first-in-class optogenetic tool for persistent, light-triggered synaptic inhibition. In addition to blocking neurotransmitter release, this approach will have broad utility for conditionally disrupting regulated secretion of diverse bioactive molecules, including neuropeptides, neuromodulators, hormones, and immune molecules. VIDEO ABSTRACT.

Keywords: Optogenetics; SNARE protein; botulinum toxin; iLID; neurotransmitter; secretion; synapse; tetanus toxin; vamp2; vesicle.


Conflict of interest statement

DECLARATION OF INTERESTS

A provisional patent application has been filed related to this study.

Figures

Figure 1.
Figure 1.. Split BoNT/B Can Be Reconstituted with Photodimerizers
(A) Schematic illustrating reconstitution of split BoNT/B light chain N- and C-terminal fragments mediated by blue light-actuated interaction between CRY2 (blue) and CIBN (orange) photodimerizers. (B) Location of split sites (purple) within BoNT/B light chain structure (PDB: 2ETF; green). The Zn2+ cofactor is shown in orange. (C and D) Quantification of light-induced reconstitution of protease activity. HEK293T cells were transfected with a GFP-VAMP-GST cleavage reporter and BoNT/B N- and C-terminal fragments split at the indicated sites. Cells were treated with 461-nm blue light (2-s pulse every 3 min, 15.6 μW/cm2) or kept in dark for 4–5 hr and then analyzed by immunoblot for reporter cleavage. Representative immunoblot results are shown in (C). The line between 211 and 254 samples indicates that the intervening lane was removed; sample 146 was on a separate blot. A summary of reporter cleavage results (average and SD of 3 independent experiments) is shown in (D). ns, not significant; *p < 0.05, 2-tailed Student’s t test. (E) Amino acids targeted for mutagenesis. Residues predicted to disrupt interaction between the 1–146 (gold) and 147–441 (purple) BoNT/B fragments are indicated in red (the Zn2+ cofactor is indicated in orange). (F) Immunoblot showing BoNT/B (146-147) interface-disrupting mutations with low dark background and significant light-regulated activity when reconstituted with CRY2/CIB1 photodimerizers. Cells were treated as in (C). The line between N157A/Y365A indicates that the intervening lane was removed; K94A samples were on a separate blot. (G) Quantification of BoNT/B 146-147 split fragments for reconstitution with iLID-SspBmilli. HEK293T cells were transfected with GFP-VAMP-GST and the indicated BoNT/B constructs and then treated as in (C). Light-treated samples were exposed to a 2-s pulse every 30 s for 4 h. Left: a representative blot; lines indicate that the intervening lanes were removed. Right: average percent cleavage and range of two independent experiments. (H) Quantification of cleavage using BoNT/B 146-147, SspBmilli, and the long-lived V416I iLID variant. HEK293T cells were treated and analyzed as in (G) except for a 2-s light pulse every 3 min. Data show average and error (SD) from 3-6 independent experiments. *p < 0.05, **p < 0.005, ***p < 0.0005, 2-tailed Student’s t test.
Figure 2.
Figure 2.. Functional Characterization of Split BoNT Variants in Neurons
(A) Light triggers reconstitution of split BoNT/B activity. Cultured hippocampal neurons were transfected with syph-GFP (to label presynaptic terminals, pink arrowheads) and either mCherry (mCh) or mCh along with full-length BoNT/B. Note the absence of VAMP2 staining in BoNT/B-expressing terminals. Right: quantification of VAMP2 staining in synaptic terminals from neurons expressing split BoNT/B variants. Cells were kept in the dark (gray bars) or exposed to blue light (1 s every 2 min, 4.5 μW/cm2) for 4 h (blue bars). Values (mean ± SEM from at least 12 cells/condition) were normalized between 0 and 1 relative to positive (full-length BoNT/B) and negative (mCh) controls. *p < 0.05, ***p < 0.0001. (B) Time course of VAMP2 cleavage in cells transfected with sPA-BoNT with SspBmilli (red circles) or SspBmicro (black squares). VAMP2 levels were normalized as in (A). Mean ± SEM are reported from at least 8 cells from 2 independent experiments. (C) Virally delivered sPA-BoNT reduces mEPSC frequency in a light-dependent manner. Left: representative AMPA mEPSC traces from cultures infected with AAVs encodings PA-BoNTmicro maintained in the dark (top) or exposed to blue light (1-s pulse every 2 min) for at least 1 h prior to recording (bottom). Right:quantification of AMPA mEPSC frequency (**p < 0.001, one-way ANOVA) and amplitude (n.s.) from uninfected cells (black, n = 18 cells) or infected cells maintained in darkness (gray, n = 20 cells) or exposed to 1–4h of blue light (blue, n = 21 cells). Scale bars, 10 pA, 5 s.
Figure 3.
Figure 3.. Targeting PA-BoNT to Vesicles Improves Its Efficacy
(A) Schematic of constructs used to target PA-BoNT to synaptic vesicles. (B) Left: examples of VAMP2 staining in presynaptic terminals (marked by syph-GFP-BoNT-iLID, pink arrows) from neurons transfected with vPA-BoNT and maintained in the dark (left) or exposed to 15 min blue light (1-s pulse every 2 min) (right). Right: quantification of the VAMP2 signal in terminals from transfected cells relative to neighboring terminals in dissociated hippocampal cultures maintained in the dark (0 min) or exposed to blue light for varying times (p < 0.0001, one-way ANOVA). The kinetics of VAMP2 cleavage by sPA-BoNT (dashed gray line) from Figure 2B is replotted for direct comparison. (C) Representative traces of mEPSCs from infected cultures kept in the dark (top) or exposed to blue light (bottom; 1-s pulse every 2 min, 4.5 μW/cm2). Scale bars, 20 pA, 5 s. (D) Left: quantification of AMPA mEPSC frequency (left) and amplitude (right) from uninfected cultures (black) or infected cultures kept in the dark (gray) or exposed to blue light for a minimum of 30 min (blue) (frequency, p < 0.05; amplitude, n.s., one-way ANOVA). Right: cumulative distribution of mEPSC inter-event interval (IEI) for cells kept in the dark (gray) or exposed to blue light (blue, *p < 0.0001, Kolmogorov-Smirnov test). (E) Time course of VAMP2 recovery following cleavage with vPA-BoNT. After 1 h light exposure, hippocampal neurons were maintained in darkness for varying times to assess the recovery of VAMP2 by immunocytochemistry as in (B). Values represent mean ± SEM from at least 11 cells from 2 independent experiments (***p < 0.0001, *p < 0.05, one-way ANOVA). (F) Time course of functional recovery. Cultured neurons infected with vPA-BoNT were treated with 1 h of blue light, and mEPSC frequency and amplitude were measured immediately following light exposure or after 8 h or 24 h of dark recovery. Data are normalized to neurons expressing vPA-BoNT but maintained in darkness for the duration. Values represent mean ± SEM from at least 9 cells per condition from two independent experiments (*p < 0.05, Student’s t test).
Figure 4.
Figure 4.. vPA-BoNT Can Locally Inhibit Neurotransmission within Minutes of Activation
(A) Postsynaptic Ca2+ transients arising from quantal neurotransmitter release can be detected with jRGECO1a. Top: dendritic segment from a cultured hippocampal neuron expressing jRGECO1a. Center: jRGECO1a within a single dendritic spine before, during, and 2 s after a spontaneous Ca2+ transient. Bottom: kymograph generated from the red line drawn through the spine (sp) and shaft (sh) at the top. Two discrete events (arrowheads) can be observed in this example. (B) Representative traces showing spontaneous Ca2+ transients at the same synapses before (left, baseline) and 60 min following (right) continuous darkness (top traces) or blue light exposure (bottom traces). (C) The frequency (top) and amplitude (bottom) of spontaneous Ca2+ transients were monitored at the same synapses over time. Data for each synapse were subtracted from its baseline (pre-light exposure) value, and the difference was divided by its baseline value. Cultures infected with vPA-BoNT (blue) show significantly reduced frequency, but not amplitude, of spontaneous Ca2+ transients compared with uninfected control neurons treated with light (black) or vPA-BoNT expressing cultures not exposed to blue light (gray). Values represent mean and SEM from 204 spines from 17 neurons (uninfected), 107 spines from 9 neurons (infected, dark), and 168 spines from 14 neurons (infected, light). **p < 0.01, ***p < 0.001, two-way ANOVA. (D) Local activation of vPA-BoNT. Cultures infected with vPA-BoNT were locally photoactivated (white box, dashed line). Representative traces show Ca2+ signals from the synapses outlined by colored squares either inside (left) or outside (right) of the illuminated region before and 30 min following local illumination. (E) Quantification of the absolute frequency of spontaneous synaptic Ca2+ transients in uninfected light-treated cultures (black) and infected cultures, with synapses quantified from the same cells either “outside” (gray) or “inside” (blue) of the illuminated region. Bars to the left of the dashed line display the baseline (pre-illumination) event frequency at individual synapses; bars to the right of the dashed line display the event frequency 30 min following local illumination. Values represent mean ± SEM from 105 spines from 9 neurons (uninfected), 108 spines from 9 neurons (outside), and 106 spines from 9 neurons (inside). **p < 0.001, ***p < 0.0001, one-way ANOVA. (F) Normalized data from (E) comparing the frequency (left) and amplitude (right) of Ca2+ transients at the same synapses before and 30 min following local illumination. The line pairings represent synapses from the same neuron either “inside” (blue) or “outside” (blue-gray checkered) of the photoactivated region. Results are compared with separate control cultures that were not expressing PA-BoNT but treated with light (black) or cultures expressing vPA-BoNT but not illuminated (gray). **p < 0.001, ***p < 0.0001, one-way ANOVA.
Figure 5.
Figure 5.. vPA-BoNT Inhibits Excitatory Neurotransmission in Hippocampal Projections to the Subiculum
(A) Top: timeline of the experiment. Bottom: schematic of the viral injection. Two AAVs encoding vPA-BoNT N- and C-terminal fragments were bilaterally co-injected into the hippocampus. (B) Representative image displaying expression of vPA-BoNT in the hippocampus. Bright-field, red (mCherry-IRES-SspBmicro-BoNT(C)), green (syph-GFP-BoNT(N)-iLID), and merged channel images are displayed. (C) Schematic of ex vivo recordings in acute hippocampal slices. Hippocampal CA1 axons were electrically stimulated to evoke AMPAR-mediated EPSCs in uninfected subicular pyramidal cells. (D) N- and C-terminal vPA-BoNT fragments expressed alone do not affect neurotransmission. Summary of evoked responses from slices prepared from uninfected (black) orsingly infected animals(red, C-terminal fragment; green N-terminal fragment). Slices were illuminated after 10 min dark baseline with 473-nm light for 30 s every min for 30 min. Right: representative traces of averaged responses: pre, 10-min baseline average; post, 15- to 30-min average. n refers to number of cells and number of animals; error bars, SEM. (E) Paired plots showing EPSC amplitudes recorded from individual cells pre- and post-light for uninfected (left), mCh-IRES-SspBmicro-BoNT(C)-infected (center), and syphGFP-BoNT(N)-iLID-infected (right) animals. (F) Summary of evoked responses from slices prepared from animals infected with AAVs encoding both fragments of vPA-BoNT. Slices were either maintained in darkness (gray, n = 11 cells from 8 animals) or illuminated after 10 min dark baseline with 473-nm light for 30 s every minute for 30 min (blue, n = 23 cells from 8 animals). Right: representative traces of averaged responses (pre, 10-min baseline average; post, 15-to 30-min average) for slices maintained in darkness (left traces) or treated with light (right traces). (G) Paired plots of EPSC amplitudes averaged over the first 10 min (pre) and last 15 min (post) for individual dark-treated (left) and light-treated (right) cells. Similar light-evoked reductions in EPSC amplitudes were obtained using vPA-BoNTmilli (red) and/or vPA-BoNTmicro (black). *p < 0.05, paired Student’s t test. (H) Summary of the ratio of EPSC amplitudes measured before and after light exposure (or for slices maintained in darkness for the same time period) and for each condition in (D) and (F). Error bars, SEM; ****p < 0.0001, one-way ANOVA.
Figure 6.
Figure 6.. vPA-BoNT Inhibits Corticostriatal Excitatory Transmission
(A) Top: timeline of the experiment. Bottom: schematic of the viral injection. Two AAVs encoding vPA-BoNT N- and C-terminal fragments were bilaterally co-injected into the M1 motor cortex. (B) Representative image displaying expression of vPA-BoNT in the cortex. Bright-field, red (mCherry-IRES-SspBmicro-BoNT(C)), green (syph-GFP-BoNT(N)-iLID), and merged channel images are displayed. (C) Schematic of ex vivo recordings in acute striatal slices. Cortical axons were electrically stimulated at the boundary of the cortex and corpus callosum to evoke AMPAR-mediated EPSCs in medium spiny neurons in the striatum. (D) Summary of evoked responses from slices prepared from wild-type (WT) control uninfected animals (black) or animals infected with AAVs encoding both fragments of vPA-BoNT (blue). Slices were illuminated after 6 min dark baseline with 470-nm light (10-s exposure each minute, 85 μW/mm2) (blue). Right: representative traces of averaged responses (baseline, 7-min baseline average; light, 10- to 15-min post flash average) for uninfected slices (left traces) or vPA-BoNT-expressing slices (right traces). (E) Paired plots of EPSC amplitudes from medium spiny neurons (MSNs) averaged over the first 7 min (baseline) and 10–15 min after light (light) from uninfected (left) and vPA-BoNT-expressing slices. **p < 0.01, paired Student’s t test. (F) Summary of the ratio of EPSC amplitudes measured before and after light exposure (light-treated value divided by baseline value) for WT control uninfected slices (gray) or slices infected with AAVs encoding both fragments of vPA-BoNT (blue). Error bars, SEM; ***p < 0.001, Student’s t test.
Figure 7.
Figure 7.. Soluble and Synaptic Vesicle-Targeted PA-BoNT Affect Locomotion Behavior in C. elegans after Photoactivation
(A) Schematic of sPA- and vPA-BoNT constructs targeted to and activated at the synaptic vesicle membrane. (B) Expression of sPA-BoNT fragments (top row) or vPA-BoNT fragments (bottom row) with GFP or mCherry tags as indicated. From left to right: transmitted light differential interference contrast (DIC), GFP, mCherry, and merged fluorescence. Shown are head (top) and body regions (bottom). Square arrows indicate fluorescence in nerve ring (top) and neuronal processes and synaptic boutons (bottom). Arrowheads indicate neuronal cell bodies. Scale bars, 50 μm. (C) Left: mean ± SEM swimming cycles of WT (N2) or transgenic animals expressing soluble or synaptic vesicle (SV)-targeted variants of PA-BoNT, as indicated, without or with pulsed illumination (blue bars, 30 s every min for 60 min, 85 μW/mm2). n = 61–176 animals, assayed in n = 2-3 experiments, as indicated for each strain and condition. Right: mean ± SEM for statistical comparisons of baseline swimming cycles, measured prior to light exposure for all groups tested. Statistical analysis: unpaired t test with Bonferroni correction, ***p < 0.00025. (D) Normalized data from (C), with data normalized to t = 0 time point. (E) Group data of animals analyzed in (C) and (D) at the 75-min time point and after 24 h recovery in the dark. Statistical analysis: paired or unpaired t test with Bonferroni correction, *p < 0.0125, **p < 0.0025, ***p < 0.00025.

References

    1. Abraham C, Hutter H, Palfreyman MT, Spatkowski G, Weimer RM, Windoffer R, Jorgensen EM, and Leube RE (2006). Synaptic tetraspan vesicle membrane proteins are conserved but not needed for synaptogenesis and neuronal function in Caenorhabditis elegans. Proc. Natl. Acad. Sci. USA 103, 8227–8232. - PMC - PubMed
    1. Alexander GM, Rogan SC, Abbas AI, Armbruster BN, Pei Y, Allen JA, Nonneman RJ, Hartmann J, Moy SS, Nicolelis MA, et al. (2009). Remote control of neuronal activity in transgenic mice expressing evolved G protein-coupled receptors. Neuron 63, 27–39. - PMC - PubMed
    1. Alfonsa H, Merricks EM, Codadu NK, Cunningham MO, Deisseroth K, Racca C, and Trevelyan AJ (2015). The contribution of raised intraneuronal chloride to epileptic network activity. J. Neurosci. 35, 7715–7726. - PMC - PubMed
    1. Aoto J, Martinelli DC, Malenka RC, Tabuchi K, and Südhof TC (2013). Presynaptic neurexin-3 alternative splicing trans-synaptically controls post-synaptic AMPA receptor trafficking. Cell 154, 75–88. - PMC - PubMed
    1. Armbruster BN, Li X, Pausch MH, Herlitze S, and Roth BL (2007). Evolving the lock to fit the key to create a family of G protein-coupled receptors potently activated by an inert ligand. Proc. Natl. Acad. Sci. USA 104, 5163–5168. - PMC - PubMed

Publication types

MeSH terms