. 2019 Mar 4;218(3):949-960.
doi: 10.1083/jcb.201712120. Epub 2019 Jan 31.

The AAA+ ATPase/ubiquitin ligase mysterin stabilizes cytoplasmic lipid droplets

Affiliations

The AAA+ ATPase/ubiquitin ligase mysterin stabilizes cytoplasmic lipid droplets

Munechika Sugihara et al. J Cell Biol. .

Abstract

Mysterin, also known as RNF213, is an intracellular protein that forms large toroidal oligomers. Mysterin was originally identified in genetic studies of moyamoya disease (MMD), a rare cerebrovascular disorder of unknown etiology. While mysterin is known to exert ubiquitin ligase and putative mechanical ATPase activities with a RING finger domain and two adjacent AAA+ modules, its biological role is poorly understood. Here, we report that mysterin is targeted to lipid droplets (LDs), ubiquitous organelles specialized for neutral lipid storage, and markedly increases their abundance in cells. This effect was exerted primarily through specific elimination of adipose triglyceride lipase (ATGL) from LDs. The ubiquitin ligase and ATPase activities of mysterin were both important for its proper LD targeting. Notably, MMD-related mutations in the ubiquitin ligase domain of mysterin significantly impaired its fat-stabilizing activity. Our findings identify a unique new regulator of cytoplasmic LDs and suggest a potential link between the pathogenesis of MMD and fat metabolism.


Figures

Figure 1.
Figure 1.
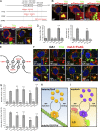
Mysterin is targeted to LDs. (A) The major isoform of human mysterin consists of 5,207 amino acids. Mysterin harbors two adjacent AAA+ modules and a single RING finger ubiquitin ligase domain. R4810K is the representative mutation associated with MMD in East Asians. (B) Transiently expressed mysterin harboring mCherry at its N terminus (mCherry-mst) partly surrounded putative spherical structures with a diameter of 1 µm in HeLa cells, while the remainder showed a diffuse cytosolic distribution (red). The nuclear chromosome was stained with Hoechst 33342 (blue). The inset shows a magnified image. The scale bars in the original and magnified images indicate 10 and 1 µm, respectively. (C) Nascent TGs are stored between the bilayer leaflets of the ER membrane and form spherical LDs on the cytoplasmic side with an encapsulating monolayer membrane and various surface proteins (schematic diagram). The right panels show neutral lipid (blue), endogenous PLIN3 (green), and endogenous ATGL (red) in HeLa cells supplemented with OA. The scale bars indicate 1 µm. (D) mCherry-mst surrounded LDs stained with BODIPY 493/503 in HeLa cells (red: mCherry; green: neutral lipid; blue: chromatin). Some LDs were not encircled by mysterin (white arrows). mCherry-mst was associated transiently with LDs or may favor a particular subset of LDs. The insets show magnified images. The scale bars in the original and magnified images indicate 10 and 1 µm, respectively. (E) Endogenous mysterin stained with anti-human mysterin antibody (1C9) showed LD targeting (red, mysterin; green, neutral lipid; and blue, chromatin). HeLa cells were treated with OA to enhance LD formation and with interferon-γ to enhance the expression of endogenous mysterin. The inset shows a magnified image. The scale bars in the original and magnified images indicate 10 and 1 µm, respectively. (F) Endogenous mysterin in HepG2 cells was stained as described in E (red, mysterin; green, neutral lipid; and blue, chromatin). The inset shows a magnified image. The scale bars in the original and magnified images indicate 10 and 1 µm, respectively. (G) mCherry-mst showed only diffuse distribution in HeLa cells in which LDs were disrupted by supplementation with a lipogenesis inhibitor triacsin C for 6 h (left panel; red, mCherry; green, neutral lipid; and blue, chromatin). The removal of triacsin C and supplementation with OA recovered both LDs and the LD distribution of mysterin (middle panel). The recovered LD targeting of mysterin was not affected by supplementation with BFA. The insets show magnified images. The scale bars in original and magnified images indicate 10 and 1 µm, respectively. (H) mCherry-mst (cell number = 5), mCherry-AUP1 (n = 5), PLIN3-GFP (n = 7), and GFP-ATGL (n = 8) were overexpressed in HeLa cells supplemented with OA. The fluorescence signals showing toroidal patterns were bleached with intense laser irradiation, and the fluorescence recovery (FRAP) was measured. The data are represented as the means ± SD.
Figure 2.
Figure 2.
Mysterin increases LDs by modulating lipolysis. (A) Although HeLa cells form a small number of LDs at 48 h after medium replacement, the overexpression of mCherry-mst resulted in the enhanced formation of LDs (red, mCherry; green, neutral lipid; blue, chromatin; asterisks, intact cells; and o/e, overexpressing cells). The scale bars indicate 10 µm. (B) Quantification of the LD abundance, of which a representative image is shown in A. The number of LDs and the area occupied by LDs were larger in mCherry-mst–overexpressing cells (mst: cell number = 32) than in control cells (intact: n = 37). The data are represented as the means ± SEM. ***, P < 0.001 (compared with intact), as analyzed using a Student’s two-tailed t test. (C) Mysterin KO using the CRISPR-Cas9 system in HeLa cells resulted in less LD formation (KO lines #1 and #2) than that in control cells (WT; green, neutral lipid; and blue, chromatin). Basal LD formation was enhanced by OA supplementation. The scale bars indicate 20 µm. (D) Quantification of LD abundance in the KO cells for which representative images are shown in C. The number of LDs and area occupied by LDs were dramatically decreased in mysterin KO cells (#1 and #2: cell numbers = 41 and 35, respectively) compared with those in control cells (WT: n = 39). The data are represented as the means ± SEM. ***, P < 0.001 (compared with WT), as analyzed using a Student’s two-tailed t test. (E) Triacsin C (TC) treatment for 6 h depleted LDs from HeLa cells even with supplementation with OA (lower panels, cells labeled with asterisks), whereas the overexpression of mCherry-mst retained LDs under the same conditions (lower panels, cells labeled as o/e; green, neutral lipid; and blue, chromatin). The upper panels show cells without triacsin C treatment. The scale bars indicate 20 µm. (F) Quantification of the LD abundance, of which representative images are shown in E. The number of LDs and the area occupied by LDs were larger in mCherry-mst–overexpressing cells (mst: cell number = 20) than in control cells (intact: n = 17). The data are represented as the means ± SEM. ***, P < 0.001 (compared with intact), as analyzed using a Student’s two-tailed t test. (G) As shown in C, mysterin KO decreased LDs in cells even in the presence of OA (upper panels; green, neutral lipid; and blue, nuclear chromatin), whereas cosupplementation with the general lipase inhibitor orlistat negated the effect of mysterin KO (lower panels). The scale bars indicate 20 µm. (H) Quantification of the results for which representative images are shown in G. The data obtained from cells not treated with orlistat (Orl; columns 1, 3, and 5) are the same as those shown in D. The numbers of the analyzed orlistat-treated cells are 45 (WT), 44 (#1), and 40 (#2). The data are represented as the means ± SEM. **, P < 0.01; and ***, P < 0.001 (compared with WT+Orl), as analyzed using a Student’s two-tailed t test.
Figure 3.
Figure 3.
Mysterin specifically eliminates ATGL from LDs. (A) LD formation in HeLa cells was saturated by supplementation with OA (red, mCherry; green, neutral lipid; blue, chromatin; and cyan, endogenous ATGL). The overexpression of mCherry-mst (labeled as o/e) resulted in markedly less decoration of LDs with ATGL in comparison to those in the intact cells (labeled with an asterisk). The inset shows magnified image. The scale bars in the original and magnified images indicate 10 and 1 µm, respectively. (B) Mysterin KO decreased LDs in HeLa cells (upper panels), whereas the decorative distribution of endogenous ATGL at LDs was conversely increased in the KO cells (lower panels; green, neutral lipid; blue, chromatin; and red, endogenous ATGL). The basal LD formation was enhanced with OA supplementation. The scale bars indicate 20 µm. (C) Quantification of the results for which representative images are shown in B. Area occupied by ATGL puncta was determined, and its ratio to the entire cell is represented as the mean ± SEM. ***, P < 0.001 (compared with WT), as analyzed using a Student's two-tailed t test. The numbers of analyzed cells are 20 (WT), 20 (KO #1), and 15 (KO #2). (D and E) HeLa cells overexpressing mCherry-mst were stained with anti-PLIN3 or anti-ATGL antibody (red, mCherry; green, endogenous PLIN3/ATGL; and gray, chromatin). LD formation was enhanced by the supplementation with OA. The insets show magnified images. The scale bars in the original and magnified images indicate 10 and 1 µm, respectively. (F) Mysterin KO decreased LDs in HeLa cells even in the presence of OA (upper panels; green, neutral lipid; and blue, chromatin), whereas the knockdown (KD) of ATGL by siRNA (#1) negated the effect of mysterin KO (lower panels). The scale bars indicate 10 µm.
Figure 4.
Figure 4.
Evaluation of enzymatic and pathogenic mutants. (A) Primary structures of the enzymatic mutants tested. Each mutant harbors mCherry at its N terminus (indicated by mCherry-). (B) Mutants harboring two mutations in the ATP binding motifs (A1A2), and Mg binding motifs essential for the ATP hydrolysis (B1B2) showed diffuse distribution despite the obvious LD formation in mysterin KO HeLa cells #1 supplemented with OA (red, mCherry-WT/A1A2/B1B2; green, neutral lipid; and blue, chromatin). The insets show magnified images. The scale bars in original and magnified images indicate 10 and 1 µm, respectively. (C) The mutant lacking the RING finger domain (ΔRING) showed amorphous aggregate-like patterns in most (∼80%) cells (left panels) but retained LD targeting to some extent in a minority (∼20%) of cells (right panels; red, mCherry-ΔRING; green, neutral lipid; and blue, chromatin). The cells did not express endogenous mysterin (KO #1 HeLa) and were treated with OA. The insets show magnified images. The scale bars in original and magnified images indicate 10 and 1 µm, respectively. (D) Mysterin KO #1 HeLa cells were treated with OA for 16 h to saturate LD formation. OA was then removed, and the cells were treated with triacsin C for 6 h to shut off the lipogenesis. The number and relative area of LDs were quantified. Cells showing the LD targeting of mCherry-ΔRING (ΔR (LD)) retained LDs, whereas those showing aggregate-like patterns (ΔR (agg)) lost their LD-retention activity. The numbers of quantified cells are 30 (mock), 30 (WT), 30 (A1A2), 30 (B1B2), 16 (ΔR (LD)), and 30 (ΔR (agg)). All the quantified data are represented as the means ± SEM. ***, P < 0.001 (compared with WT), as analyzed using a Student's two-tailed t test. (E) Mysterin most likely harbors the HC subtype of the RING finger domain, in which eight conserved cysteine/histidine residues chelate with two zinc ions. Four of these residues were mutated in rare Caucasian MMD cases (C3997Y, H4014N, C4017S, and C4032R). (F) The C3997Y (CY), H4014N (HN), C4017S (CS), and C4032R (CR) mutants harboring FLAG tags at their C termini showed aggregate-like patterns in most (∼80%) cells (upper panels) but retained LD targeting to some extent in a minority (∼20%) of cells (lower panels; red, FLAG; green, neutral lipid; and blue, chromatin). The cells did not express endogenous mysterin (KO #1 HeLa) and were treated with OA. The insets show magnified images. The scale bars in original and magnified images indicate 10 and 1 µm, respectively. (G) Mysterin KO #1 HeLa cells were treated with OA for 16 h to saturate LD formation. OA was then removed, and the cells were treated with triacsin C for 6 h to shut off the lipogenesis. The number and relative area of LDs were quantified. Cells showing the LD targeting of each mutant (LD) retained LDs, whereas those showing aggregate-like patterns (agg) lost their LD-retention activity. The numbers of quantified cells are 30 (agg) and 10 (LD) for each mutant. All the quantified data are represented as the means ± SEM. ***, P < 0.001 (compared with WT), as analyzed using a Student's two-tailed t test. (H) Katanin and Vps4 assemble on their substrates microtubules and the ESCRT-III complex, respectively, upon ATP binding. They dissociate after disassembling the substrate complexes upon ATP hydrolysis. (I) Given the analogy with katanin/Vps4, mysterin could assemble on LDs (or surface proteins) upon ATP binding, mediate a mechanical process upon ATP hydrolysis to eliminate ATGL from LDs, and return to the diffusive monomer forms.

Similar articles

Cited by

References

    1. Baldridge R.D., and Rapoport T.A.. 2016. Autoubiquitination of the Hrd1 Ligase Triggers Protein Retrotranslocation in ERAD. Cell. 166:394–407. 10.1016/j.cell.2016.05.048 - DOI - PMC - PubMed
    1. Banh R.S., Iorio C., Marcotte R., Xu Y., Cojocari D., Rahman A.A., Pawling J., Zhang W., Sinha A., Rose C.M., et al. . 2016. PTP1B controls non-mitochondrial oxygen consumption by regulating RNF213 to promote tumour survival during hypoxia. Nat. Cell Biol. 18:803–813. 10.1038/ncb3376 - DOI - PMC - PubMed
    1. Bhandari S., Lee J.N., Kim Y.-I., Nam I.-K., Kim S.-J., Kim S.-J., Kwak S., Oh G.-S., Kim H.-J., Yoo H.J., et al. . 2016. The fatty acid chain elongase, Elovl1, is required for kidney and swim bladder development during zebrafish embryogenesis. Organogenesis. 12:78–93. 10.1080/15476278.2016.1172164 - DOI - PMC - PubMed
    1. Cecchi A.C., Guo D., Ren Z., Flynn K., Santos-Cortez R.L.P., Leal S.M., Wang G.T., Regalado E.S., Steinberg G.K., Shendure J., et al. University of Washington Center for Mendelian Genomics . 2014. RNF213 rare variants in an ethnically diverse population with Moyamoya disease. Stroke. 45:3200–3207. 10.1161/STROKEAHA.114.006244 - DOI - PMC - PubMed
    1. Guey S., Kraemer M., Hervé D., Ludwig T., Kossorotoff M., Bergametti F., Schwitalla J.C., Choi S., Broseus L., Callebaut I., et al. ; FREX Consortium . 2017. Rare RNF213 variants in the C-terminal region encompassing the RING-finger domain are associated with moyamoya angiopathy in Caucasians. Eur. J. Hum. Genet. 25:995–1003. 10.1038/ejhg.2017.92 - DOI - PMC - PubMed

Publication types

MeSH terms