

Estimating the long-run relationship between state cigarette taxes and county life expectancy
- PMID: 30705247
- PMCID: PMC6669122
- DOI: 10.1136/tobaccocontrol-2018-054686
Estimating the long-run relationship between state cigarette taxes and county life expectancy
Abstract
Introduction: While a large body of literature suggests that tobacco control legislation-including fiscal measures such as excise taxes-effectively reduces tobacco smoking, the long-run (10+ years) relationship between cigarettes excise taxes and life expectancy has not been directly evaluated. Here, we test the hypothesis that increases in state cigarette excise taxes are positively associated with long-run increases in population-level life expectancy.
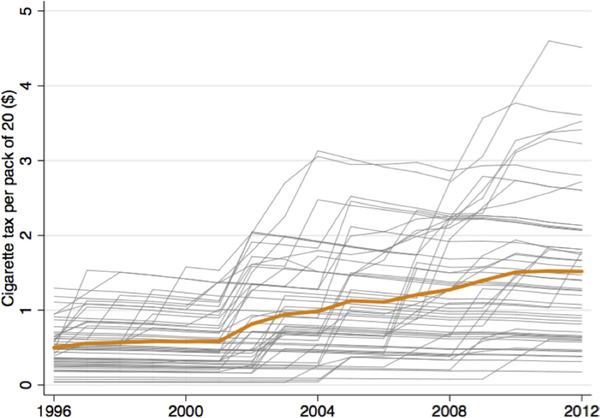
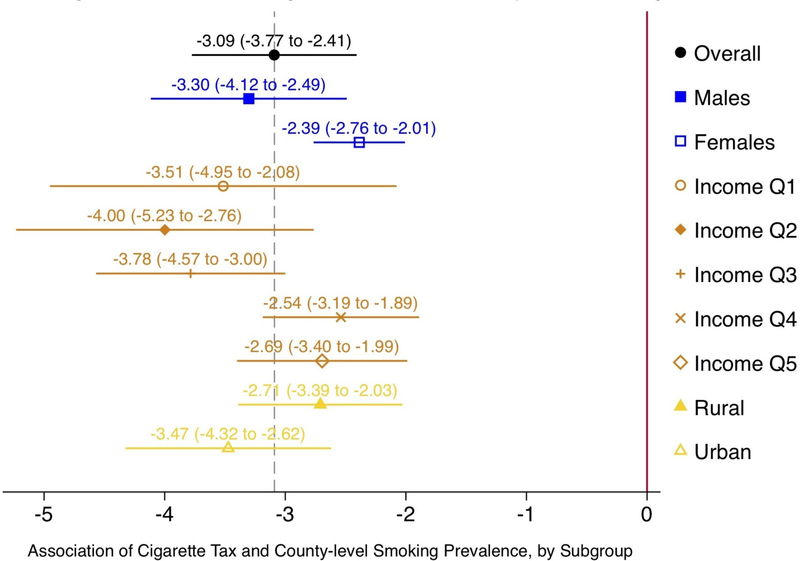
Methods: We studied age-standardised life expectancy among all US counties from 1996 to 2012 by sex, in relation to state cigarette excise tax rates by year, controlling for other demographic, socioeconomic and county-specific features. We used an error-correction model to assess the long-run relationship between taxes and life expectancy. We additionally examine whether the relationship between cigarette taxes and life expectancy was mediated by changes to county smoking prevalence and varied by the sex, income and rural/urban composition of a county.
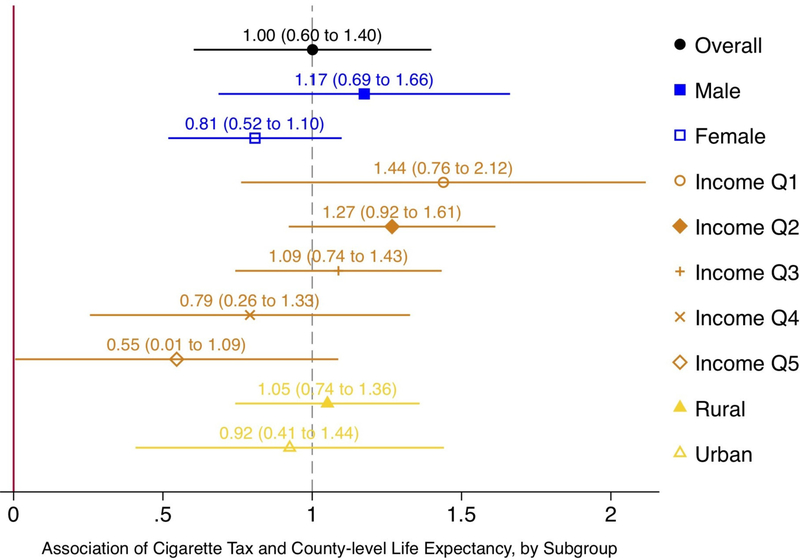
Results: For every one-dollar increase in cigarette tax per pack (in 2016 dollars), county life expectancy increased by 1 year (95% CI 0.60 to 1.40 years) over the long run, with the first 6-month increase in life expectancy taking 10 years to materialise. The association was mediated by changes in smoking prevalence and the magnitude of the association steadily increased as county income decreased.
Conclusions: Results suggest that increasing cigarette excise tax rates translates to consequential population-level improvements in life expectancy, with larger effects in low-income counties.
Keywords: public policy; smoking caused disease; taxation.
© Author(s) (or their employer(s)) 2020. No commercial re-use. See rights and permissions. Published by BMJ.
Conflict of interest statement
Competing interests: None declared.
Figures
References
-
- Chaloupka FJ, Yurekli A, Fong GT. Tobacco taxes as a tobacco control strategy. Tob Control 2012;21:172–80. - PubMed
Publication types
MeSH terms
Grants and funding
LinkOut - more resources
Full Text Sources