. 2019 Jan 31;9(1):50.
doi: 10.1038/s41398-018-0335-z.

Disruption of mTOR and MAPK pathways correlates with severity in idiopathic autism

Affiliations

Disruption of mTOR and MAPK pathways correlates with severity in idiopathic autism

Eleonora Rosina et al. Transl Psychiatry. .

Abstract

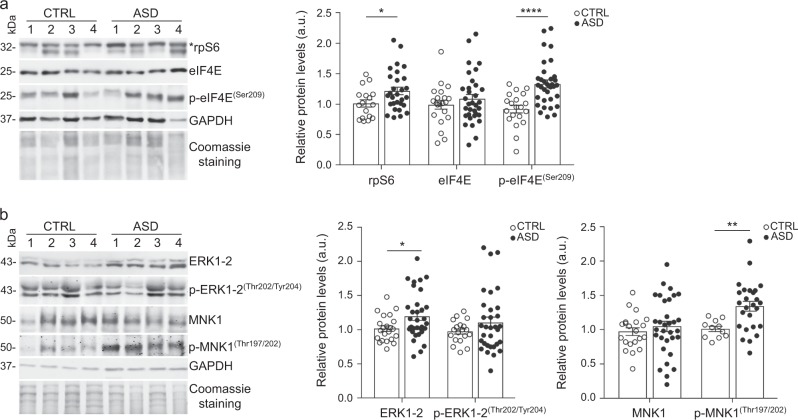
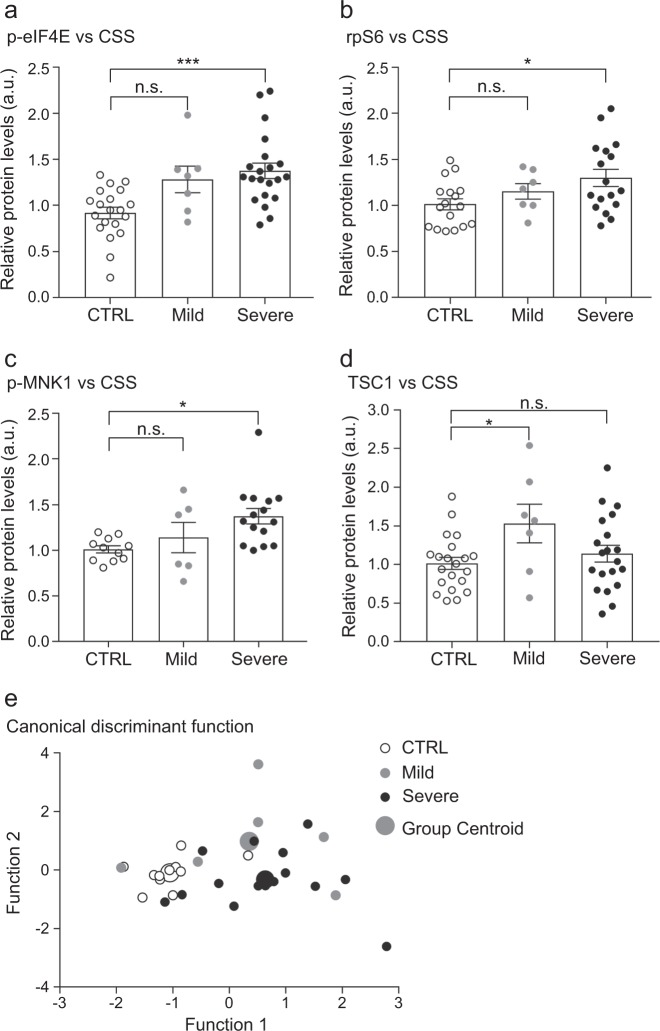
The molecular signature underlying autism spectrum disorder remains largely unknown. This study identifies differential expression of mTOR and MAPK pathways in patients affected by mild and severe idiopathic autism. A total of 55 subjects were enrolled, of which 22 were typically developing individuals and 33 were patients aged between 3 and 11 years, with autism spectrum disorder. A detailed history, including physical examination, developmental evaluation, mental health history and autism diagnostic observation schedule were performed for each patient. Components of the mTOR and MAPK signalling pathways were analysed from peripheral blood at the protein level. Patients were then stratified according to their clinical phenotypes, and the molecular profiling was analysed in relation to the degree of autism severity. In this cohort of patients, we identified increased activity of mTOR and the MAPK pathways, key regulators of synaptogenesis and protein synthesis. Specifically, rpS6, p-eIF4E, TSC1 and p-MNK1 expression discriminated patients according to their clinical diagnosis, suggesting that components of protein synthesis signalling pathways might constitute a molecular signature of clinical severity in autism spectrum disorder.


Conflict of interest statement

The authors declare that they have no conflict of interest.

Figures

Fig. 1
Fig. 1. Protein levels in PBMCs of patients with non-syndromic autism and controls.
a Left, representative Western blot showing protein levels of rpS6, eIF4E and p-eIF4E (Ser209). The molecular weight of each protein is indicated in kDa. Right, bar plots representing the quantification of the technical replicates where rpS6 and p-eIF4E levels are increased in ASD patients compared with controls (rpS6: U= 150, p= 0.03; p-eIF4E: U = 115, p< 0.0001). Error bars represent the standard error of the mean (n = 11-22 CTRL, 26-33 ASD; *p < 0.05, **p < 0.01, ***p < 0.001, ****p < 0.0001; Mann–Whitney U tests). Each dot represents the average of at least two technical replicates per subject. Total proteins were normalised to the average of Coomassie staining and GAPDH. Phosphoproteins were normalised for respective total protein levels. *indicates the quantified signal b Left, representative Western blot showing protein levels of ERK 1-2, p-ERK 1-2 (Thr202/Tyr204), MNK1 and p-MNK1 (Thr197/202). The molecular weight of each protein is indicated in kDa. Right, bar plots representing the quantification of the technical replicates, where ERK1-2 and p-MNK1 levels are increased in ASD patients compared with controls (ERK1/2: U= 242.5, p= 0.04; p-MNK1: U = 58.5, p= 0.004)
Fig. 2
Fig. 2. Protein levels in PBMCs correlate with the severity of the clinical phenotype.
Bar plots representing the quantification of the technical replicates in the three subgroups, CTRL, Mild ASD and Severe ASD show significantly increased levels of a p-eIF4E (F(2,45) = 9.51; p= 0.0004) b rpS6 (F(2,38) = 3.70; p= 0.03) and c p-MNK1 (F(2,29) = 5.02; p= 0.01) in the severe subgroup compared to controls, while d TSC1 levels were significantly increased in the mild group only (F(2,45) = 3.24; p= 0.048). Error bars represent the standard error of the mean (n = 11-21 CTRL, 6-7 Mild ASD, 11-20 Severe ASD; *p < 0.05, **p < 0.01, ***p < 0.001; one-way ANOVA). e Scatter plot of the two canonical functions containing four proteins (p-eIF4E, rpS6, TSC1, p-MNK1) that discriminated subjects according to their severity into three groups: CTRL, mild ASD and severe ASD (Wilks’ Lambda = 0.480; Chi-square = 20.2; df = 8; p= 0.01). The mean discriminant scores for each group are depicted as group centroids. Four patients were not included in this analysis (see Table 1)
Fig. 3
Fig. 3. Upregulated pathways leading to excessive protein synthesis in the context of severe ASD.
p-MNK1, p-eIF4E, TSC1 and rpS6 discriminate mild and severe ASD. Color code indicates different pattern of expression across the two ASD groups. Dark pink denotes upregulated proteins in severe ASD (p-MNK1, p-eIF4E and rpS6). Light pink denotes upregulated TSC1 in mild ASD. The dysregulation of each of those proteins can lead to an excessive protein synthesis

Similar articles

Cited by

References

    1. Bhat S, Acharya UR, Adeli H, Bairy GM, Adeli A. Autism: cause factors, early diagnosis and therapies. Rev. Neurosci. 2014;25:841–850. - PubMed
    1. Volkmar FR, McPartland JC. From Kanner to DSM-5: autism as an evolving diagnostic concept. Annu. Rev. Clin. Psychol. 2014;10:193–212. - PubMed
    1. Fakhoury M. Autistic spectrum disorders: a review of clinical features, theories and diagnosis. Int. J. Dev. Neurosci. 2015;43:70–77. - PubMed
    1. Curatolo P, Moavero R, de Vries PJ. Neurological and neuropsychiatric aspects of tuberous sclerosis complex. Lancet Neurol. 2015;14:733–745. - PubMed
    1. Wang LW, Berry-kravis E, Hagerman RJ. Fragile X: leading the way for targeted treatments in autism. Neurotherapeutics. 2010;7:264–274. - PMC - PubMed

Publication types

MeSH terms

Substances