. 2019 Jan 31;10(1):529.
doi: 10.1038/s41467-019-08465-x.

Volume expansion and TRPV4 activation regulate stem cell fate in three-dimensional microenvironments

Affiliations

Volume expansion and TRPV4 activation regulate stem cell fate in three-dimensional microenvironments

Hong-Pyo Lee et al. Nat Commun. .

Abstract

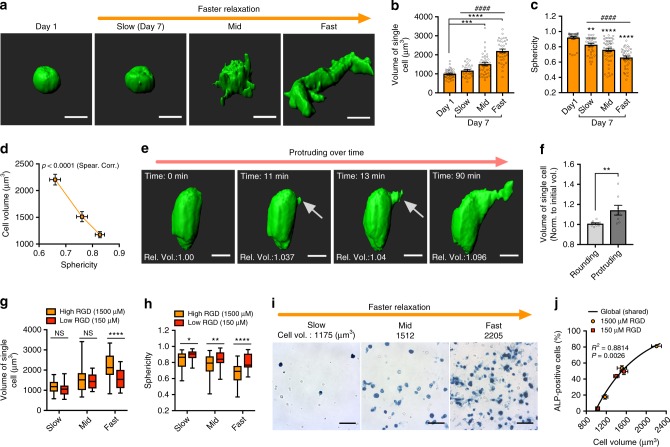
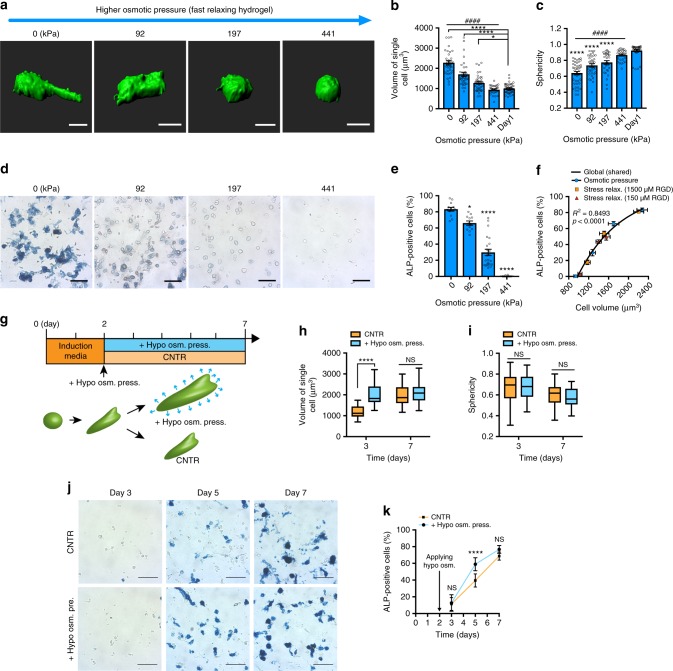
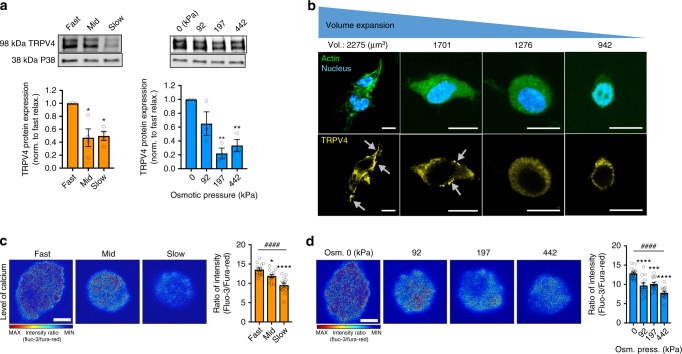
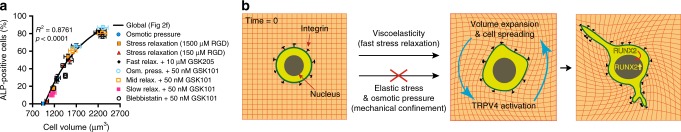
For mesenchymal stem cells (MSCs) cultured in three dimensional matrices, matrix remodeling is associated with enhanced osteogenic differentiation. However, the mechanism linking matrix remodeling in 3D to osteogenesis of MSCs remains unclear. Here, we find that MSCs in viscoelastic hydrogels exhibit volume expansion during cell spreading, and greater volume expansion is associated with enhanced osteogenesis. Restriction of expansion by either hydrogels with slow stress relaxation or increased osmotic pressure diminishes osteogenesis, independent of cell morphology. Conversely, induced expansion by hypoosmotic pressure accelerates osteogenesis. Volume expansion is mediated by activation of TRPV4 ion channels, and reciprocal feedback between TRPV4 activation and volume expansion controls nuclear localization of RUNX2, but not YAP, to promote osteogenesis. This work demonstrates the role of cell volume in regulating cell fate in 3D culture, and identifies TRPV4 as a molecular sensor of matrix viscoelasticity that regulates osteogenic differentiation.


Conflict of interest statement

The authors declare no competing interests.

Figures

Fig. 1
Fig. 1
Stress relaxation regulates MSC volume expansion cell and osteogenesis. a Representative 3D renderings of single MSCs from confocal imaging of a cell membrane dye at the indicated levels of stress relaxation. MSCs were cultured in hydrogels with an initial modulus of ~20 kPa and different rates of stress relaxation for 7 days. Scale bar is 10 µm. b, c Quantification of cell volumes or sphericity of MSCs cultured in indicated conditions. (n ≥ 30 single cells from three biological replications per each condition, ####p<0.0001 by Spearman’s rank correlation, ****p<0.0001, ***p<0.001, and **p<0.01 compared with cells cultured for 1 day by one-way ANOVA test in b, c). d Scatter plot of cell volume versus sphericity of cells cultured in hydrogels with varying stress relaxation for 7 days. e 3D renderings of a single cell extending a protrusion in a fast-relaxing hydrogel. Arrow indicates protrusion on cell. Scale bar is 10 µm.  f Quantification of altered volume of protruding or control cells during constant observation time (t < 2 h, n = 10 single cells, **p<0.001 by Student’s t test). g, h Quantification of cell volume (g) and sphericity (h) of MSCs cultured in hydrogels with different rate of stress relaxation for 7 days with a RGD density of 150 µM and 1500 µM (*p<0.05, **p<0.001, and ****p<0.0001 by two-way ANOVA). The box plots show 25/50/75th percentiles and whiskers show minimum/maximum. i Representative images of alkaline phosphatase staining (blue), indicating early osteogenic differentiation, for MSC cultured in gels of indicated stress relaxation for 7 days. Scale bar, 25 µm. j Scatter plot of cell volume with the percentage of cells positively stained for alkaline phosphatase produced by MSCs cultured in hydrogels with varying stress relaxation for 7 days with a RGD density of 150 µM and 1500 µM. All data show as mean ± s.e.m. MSC mesenchymal stem cell, 3D three-dimensional
Fig. 2
Fig. 2
Volume expansion regulates osteogenesis of MSCs in fast-relaxing hydrogels. a Representative 3D renderings of single MSCs from confocal imaging of a cell membrane dye within fast-relaxing hydrogels for 7 days under the indicated osmotic pressure. Scale bar, 10 µm. b, c Quantification of cell volumes (b) and sphericity (c) of MSCs cultured in fast-relaxing gels with a RGD concentration of 1500 µM under varied osmotic pressures for 7 days (n ≥ 30 single cells from three biological replications per each condition). d Representative images of alkaline phosphatase staining for MSC cultured in fast-relaxing gels under indicated osmotic pressure for 7 days. Scale bar, 25 µm. e Quantification of the percentage of cells positively stained for alkaline phosphatase produced by MSCs cultured for 7 days under indicated conditions (n ≥ 10 images from three biological replications per each condition). f Scatter plot of cell volume with the percentage of cells positively stained for alkaline phosphatase produced by MSCs when volume of single cells was modulated by varying stress relaxation, RGD density, or osmotic pressure. A non-linear regression analysis showed a global trend of osteogenic differentiation with volume of single cells. g Schematic of protocol for application of hypoosmotic pressure to enhance volume expansion. h, i Quantification of cell volume (h) and sphericity (i) for MSCs cultured under hypoosmotic pressure or control conditions at days 3 and 7 (n ≥ 30 single cells from three replications per each condition). The box plots show 25/50/75th percentiles and whiskers show minimum/maximum. j Representative images of ALP staining of MSCs cultured in hypoosmotic media or control media at days 3, 5, and 7 (n ≥ 10 images from three replications per each condition). k Quantification of ALP-positive cells for MSCs in hypoosmotic or control medium at days 3, 5, and 7. (n ≥ 8 images from three replications per each condition). All data are shown as mean ± s.e.m. For one-way ANOVA comparisons; *p<0.05, **p<0.01, ***p<0.001, and ****p<0.0001 and for Spearman’s rank correlation; ####p<0.0001
Fig. 3
Fig. 3
TRPV4 expression and activation is strongly correlated with volume expansion. a Western blot analysis and quantification of TRPV4 ion-channel protein expression (TRPV4) in MSCs cultured in hydrogel with varying stress relaxation and in fast-relaxing hydrogel with altered osmotic pressure for 7 days (**p<0.01 and *p<0.05, respectively, compared with fast stress relaxation and 0 kPa osmotic pressure case by one-way ANOVA test). b Representative images of immunohistochemical stainings of TRPV4 (yellow), actin (green), and nucleus (blue) of MSCs with different average volume of single cells. Arrows indicate a region of dense TRPV4 staining at cell periphery. Scale bar, 10 µm. c, d Representative images and quantification of intracellular calcium in MSCs cultured in hydrogel with varying stress relaxation (c) and in fast-relaxing hydrogel with altered osmotic pressure (d) for 7 days (****p<0.0001, ***p<0.001, and *p<0.05, respectively, compared with fast stress relaxation and 0 kPa osmotic pressure case by one-way ANOVA test, ####p<0.0001 by Spearman’s rank correlation). Scale bar, 5 µm. All data are shown as mean ± s.e.m.
Fig. 4
Fig. 4
Feedback between TRPV4 activation and volume expansion regulates osteogenesis. a Representative images with ALP staining of MSCs cultured in fast-relaxing hydrogel with or without treatment of TRPV4 antagonist for 7 days. b Quantification of the percentage of cells positively stained for ALP under indicated conditions (n ≥ 10 images from three biological replications per each condition, ****p<0.0001 compared with control by one-way ANOVA test). The box plots show 25/50/75th percentiles and whiskers show minimum/maximum. c, d Quantification of cell volumes (c) and sphericity (d) of MSCs cultured in fast-relaxing gels under indicated conditions for 7 days (n ≥ 35 single cells from three biological replications per each condition, ****p<0.0001, and **p<0.01 by one-way ANOVA test). e, f Representative images of ALP staining and quantifications of the percentage of cells positively stained for ALP of MSCs cultured in fast-relaxing hydrogel under osmotic pressure of 92 kPa (e) and in mid relaxing hydrogel under osmotic pressure of 0 kPa (f) with or without treatment of TRPV4 agonist for 7 days (n ≥ 10 images from three biological replications per each condition, ****p<0.0001 by student t test). g, h Quantification of volume of single cells cultured in fast-relaxing hydrogel under osmotic pressure of 92 kPa (g) and in mid relaxing hydrogel under osmotic pressure of 0 kPa (h) with or without treatment of TRPV4 agonist for 7 days (n ≥ 30 single cells from three biological replications per each condition, ***p<0.001 by Student's t test). i Scatter plot of cell volume with the percentage of cells positively stained for ALP, when MSCs were cultured in indicated conditions with treatment of TRPV4 antagonist or agonist. The black line obtained by linear regression of data in Fig. 2f is shown. Scale bar, 25 µm. All data are shown as mean ± s.e.m.
Fig. 5
Fig. 5
Volume expansion regulates osteogenesis of MSCs independent of morphology. a, b Quantification of sphericity of single cells cultured in fast-relaxing hydrogel under osmotic pressure of 92 kPa (a) and in mid relaxing hydrogel under osmotic pressure of 0 kPa (b) with or without treatment of TRPV4 agonist for 7 days (n ≥ 25 single cells from three biological replications per each condition, NS p>0.05 by Student's t test). c Schematic of protocol for delayed exposure of osmotic pressure to restrict volume expansion during differentiation after culturing MSCs in growth media for 7 days. d, e Representative 3D images of a single cell cultured in fast-relaxing hydrogel with growth media for 7 days (d) and cultured with induction media with or without osmotic pressure for additional 7 days. f, g Quantification of sphericity (f) and volume (g) of single cells cultured in indicated conditions (n ≥ 35 single cells from three biological replications per each condition, ****p<0.0001, ***p<0.001, and NS p>0.05 by one-way ANOVA test). h Representative images of ALP staining and quantifications of the percentage of cells positively stained for ALP of MSCs cultured in indicated conditions (n ≥ 10 images from three biological replications per each condition, ****p<0.0001 by Student's t test)
Fig. 6
Fig. 6
Volume expansion enhances nuclear translocation of RUNX2 but not YAP. a, b Representative images of YAP (red), actin (green), and nucleus (blue) of MSCs cultured in hydrogels with varying stress relaxation (a) and in fast-relaxing hydrogels with altered osmotic pressure (b) for 7 days. Bar graphs indicates quantification nuclear:cytoplasmic YAP ratio. c, d Representative images of RUNX2 (yellow), actin (green), and nucleus (blue) of MSCs cultured in hydrogels with varying stress relaxation (c) and in fast-relaxing hydrogels with altered osmotic pressure (d) for 7 days. Bar graphs indicates quantification of nuclear:cytoplasmic RUNX2 ratio. e Quantification of nuclear:cytoplasmic RUNX2 for MSCs in hypoosmotic or control medium at days 3, 5, and 7. (n ≥ 40 images from three replications per condition). f, g Representative images of RUNX2 (yellow), actin (green), and nucleus (blue) of MSCs cultured in fast-relaxing hydrogel with or without treatment of TRPV4 antagonist (f) and in mid relaxing hydrogel with or without treatment of TRPV4 agonist (g) for 7 days. Bar graphs indicate quantification of nuclear:cytoplasmic RUNX2. h Scatter plot of cell volume versus nuclear:cytoplasmic RUNX2 (yellow) and YAP (red) ratios. Linear regression analysis showed a trend of nuclear RUNX2 with cell volume. Nuclear:cytoplasmic ratios were quantified with n ≥ 60 images from three biological replications per condition. i Representative images of ALP staining and quantifications of ALP-positive cells for MSCs cultured in fast-relaxing hydrogels with or without treatment of the ERK inhibitor for 7 days (n ≥ 15 images from three replications per condition). Scale bar, 25 µm. j Representative images of RUNX2 (yellow), actin (green), and nucleus (blue) and quantification of the nuclear:cytoplasmic RUNX2 ratio (n ≥ 30 images from three replicates). k Quantification of the volume of single cells cultured in indicated conditions (n ≥ 30 cells from three replications per condition). Scale bar in all immunostaining images is 10 µm. All data are shown as mean ± s.e.m. For one-way ANOVA comparisons and Student’s t test; *p<0.05, **p<0.01, ***p<0.001, and ****p<0.0001 and for Spearman’s rank correlation; ####p<0.0001
Fig. 7
Fig. 7
Volume expansion and TRPV4 dictate cell fate response to viscoelasticity. a Percentage of ALP-positive cells as a function of cell volume for all the different conditions probed in this study appear to follow a single relationship. b Cartoon schematic of proposed mechanism. MSCs cultured in viscoelastic matrices physically remodel their microenvironment to expand cell volume associated with spreading. The volume expansion is interdependent with TRPV4 activation, which enhances osteogenic differentiation of MSCs by increasing nuclear localization of RUNX2. In this process, mechanical confinement by either elastic stress or osmotic pressure of surrounding environment restricts cell volume expansion, impeding osteogenic commitment

References

    1. Engler AJ, Sen S, Sweeney HL, Discher DE. Matrix elasticity directs stem cell lineage specification. Cell. 2006;126:677–689. doi: 10.1016/j.cell.2006.06.044. - DOI - PubMed
    1. Wozniak MA, Chen CS. Mechanotransduction in development: a growing role for contractility. Nat. Rev. Mol. Cell Biol. 2009;10:34–43. doi: 10.1038/nrm2592. - DOI - PMC - PubMed
    1. Huebsch N, et al. Harnessing traction-mediated manipulation of the cell/matrix interface to control stem-cell fate. Nat. Mater. 2010;9:518–526. doi: 10.1038/nmat2732. - DOI - PMC - PubMed
    1. Parekh SH, et al. Modulus-driven differentiation of marrow stromal cells in 3D scaffolds that is independent of myosin-based cytoskeletal tension. Biomaterials. 2011;32:2256–2264. doi: 10.1016/j.biomaterials.2010.11.065. - DOI - PMC - PubMed
    1. Yang C, Tibbitt MW, Basta L, Anseth KS. Mechanical memory and dosing influence stem cell fate. Nat. Mater. 2014;13:645–652. doi: 10.1038/nmat3889. - DOI - PMC - PubMed

Publication types

MeSH terms

Substances