. 2019 Jan 31;10(1):521.
doi: 10.1038/s41467-019-08381-0.

Promoter-proximal pausing mediated by the exon junction complex regulates splicing

Affiliations

Promoter-proximal pausing mediated by the exon junction complex regulates splicing

Junaid Akhtar et al. Nat Commun. .

Abstract

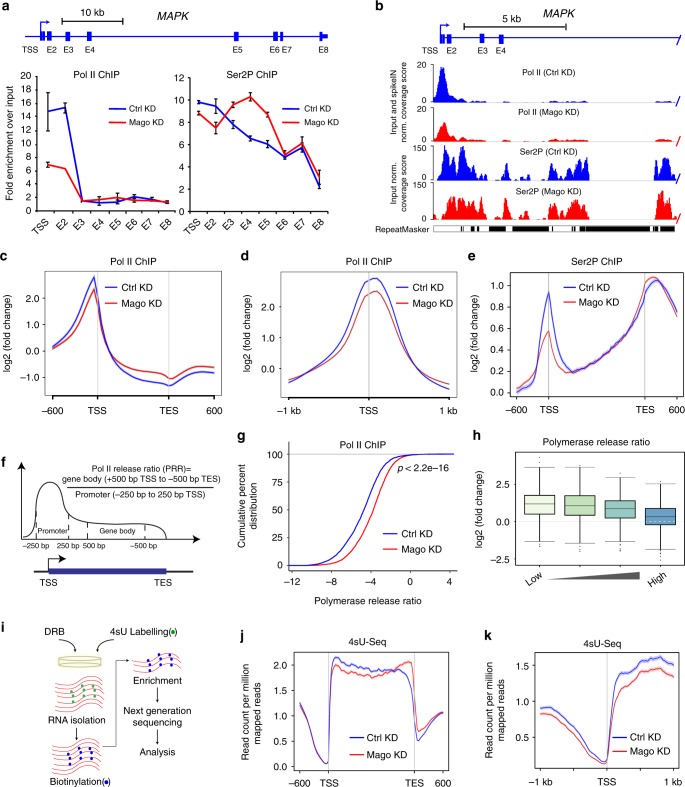
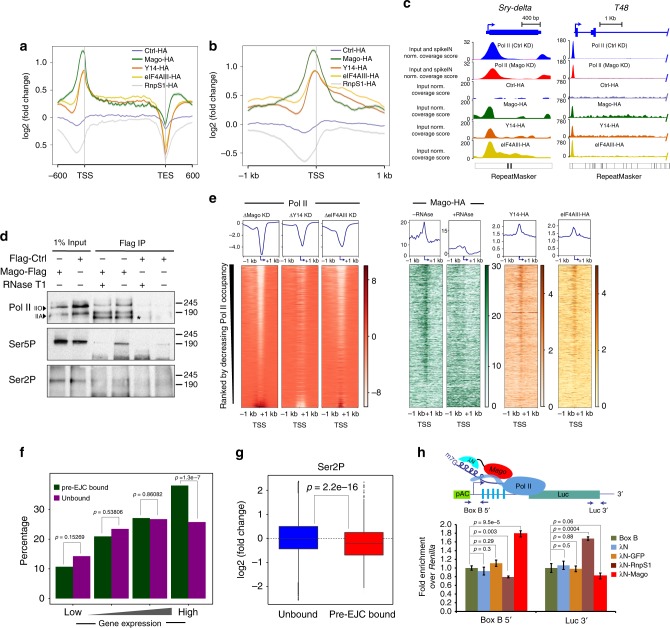
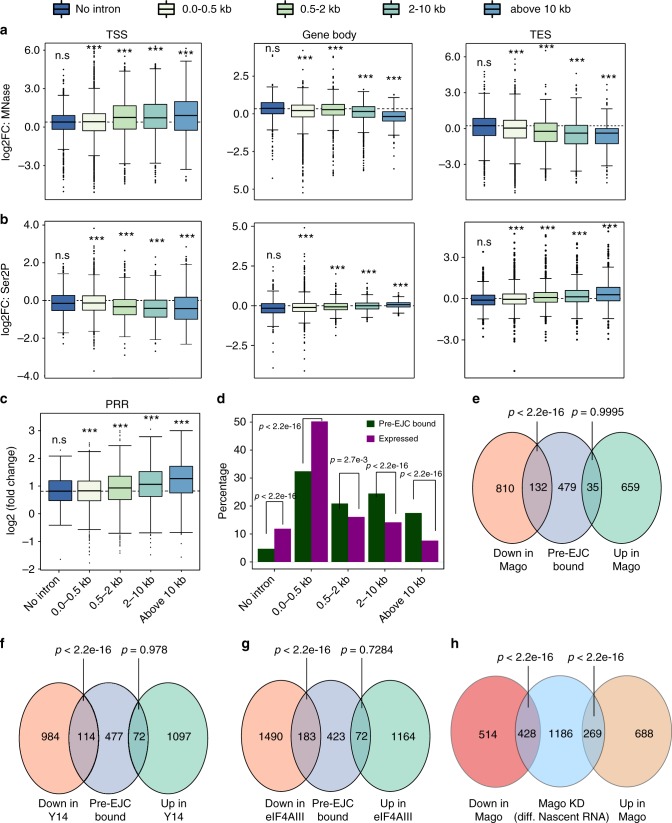
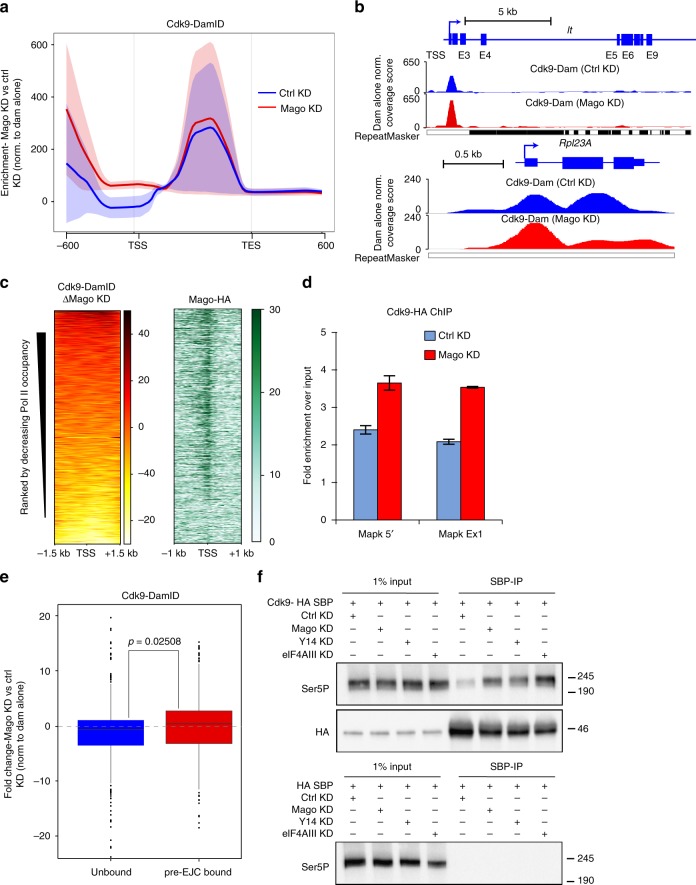
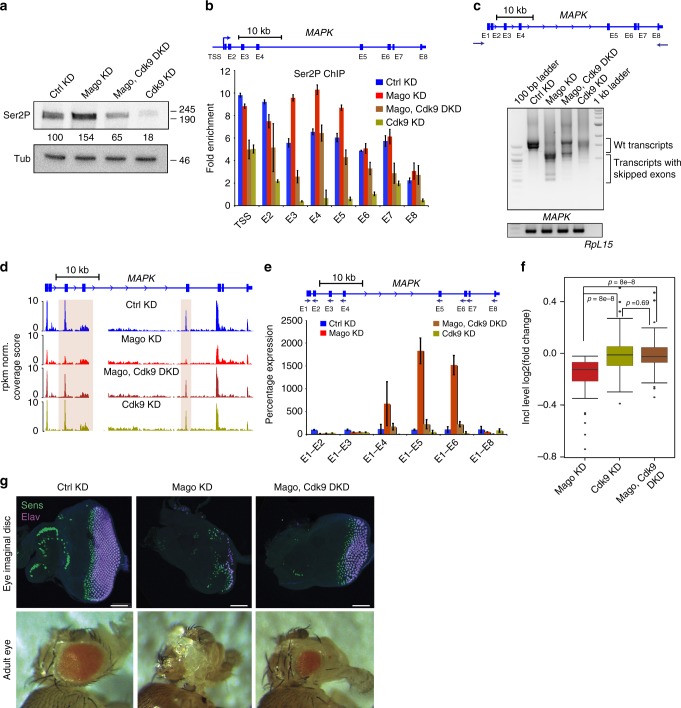
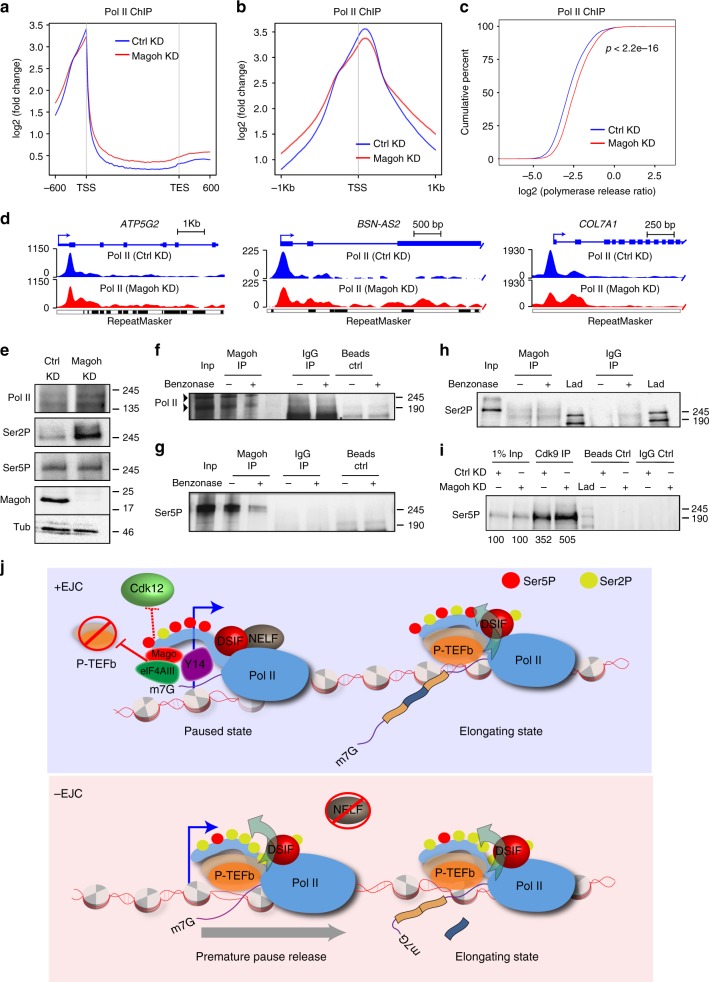
Promoter-proximal pausing of RNA polymerase II (Pol II) is a widespread transcriptional regulatory step across metazoans. Here we find that the nuclear exon junction complex (pre-EJC) is a critical and conserved regulator of this process. Depletion of pre-EJC subunits leads to a global decrease in Pol II pausing and to premature entry into elongation. This effect occurs, at least in part, via non-canonical recruitment of pre-EJC components at promoters. Failure to recruit the pre-EJC at promoters results in increased binding of the positive transcription elongation complex (P-TEFb) and in enhanced Pol II release. Notably, restoring pausing is sufficient to rescue exon skipping and the photoreceptor differentiation defect associated with depletion of pre-EJC components in vivo. We propose that the pre-EJC serves as an early transcriptional checkpoint to prevent premature entry into elongation, ensuring proper recruitment of RNA processing components that are necessary for exon definition.


Conflict of interest statement

The authors declare no competing interests.

Figures

Fig. 1
Fig. 1
Mago prevents premature release into transcription elongation. a ChIP-qPCR analysis of Pol II and Ser2P occupancies at MAPK locus. The tested regions for enrichment are shown in the scheme. Error bars indicate the standard deviation of three biological replicates. b Track examples of total Pol II and Ser2P ChIP-Seq from S2R+ cells extracts, after either control or Mago knockdown. The tracks are average of two independent biological replicates after input and “spike-in” normalization. Shown here are the profiles on MAPK, a well-described pre-EJC target gene. c, d Metagene profiles of averaged total Pol II occupancies from two independent biological replicates after “spike-in” normalization in control and Mago-depleted cells along with standard error of mean for all the expressed genes, −600 bp upstream of transcription start sites (TSS) and +600 bp downstream of transcription end sites (TES) (c); or centered at the TSS in a ±1 Kb window (d). Log2 fold changes against input control are shown on Y-axis, while X-axis depicts genomic coordinates. e Metagene profiles of averaged Ser2P occupancies in control and Mago-depleted cells of two independent biological replicates also displaying standard error of mean for all expressed genes. Log2 fold changes against input control are shown on Y-axis, while X-axis depicts scaled genomic coordinates. f Schematic representation of the calculation of the Pol II release ratio (PRR). The promoter is defined as 250 bp upstream and downstream of TSS, while the gene body is 500 bp downstream of TSS to 500 bp upstream of transcription end site (TES). g The empirical cumulative distribution function (ECDF) plot of computed PRR in control and Mago knockdown conditions, after “spike-in” normalization. p-value is derived from two-sample Kolmogorov-Smirnov test. h Box plots showing changes in PRRs upon Mago depletion when compared to control, separated into different PRR quartiles. The quartiles were generated for genes that are Pol II bound in both control and Mago knockdown conditions. i Schematic depiction of the DRB-4sU-Seq approach. j Metagene profile of nascent RNA from non-DRB treated 4sU-Seq data in control and Mago-depleted cells, with standard error of mean for all the expressed genes. Averaged read counts per million of mapped reads of two independent biological replicates from 4sU-Seq are shown on Y-axis while X-axis depicts scaled genomic coordinates. k Metagene profile of nascent RNA from non-DRB treated 4sU-Seq data in control and Mago-depleted cells with standard error of mean for all the expressed genes based on the average of two independent biological replicates, centered at the TSS in a ±1 Kb window. Nascent RNA was fragmented to ≤100 bp during enrichment. Averaged read counts per million of mapped reads of two independent biological replicates from 4sU-Seq are shown on Y-axis while X-axis depicts genomic coordinates
Fig. 2
Fig. 2
Mago binding to promoter regions modulates Pol II pausing. a Metagene profiles of ChIP-Seq performed with HA-tagged Mago, Y14, eIF4AIII, and Ctrl, with standard error of the mean for all the expressed genes based on averaged enrichment over input for two independent biological replicates. Log2 fold changes against input control are shown on Y-axis while X-axis depicts scaled genomic coordinates. b Metagene profiles with standard error of mean based on average enrichment over input for two independent biological replicates of ChIP-Seq performed with HA-tagged Mago, Y14, eIF4AIII, and Ctrl, centered at the TSS in a ±1 Kb window. Log2 fold changes against input control are shown on Y-axis while X-axis depicts genomic coordinates. c Input normalized and replicate averaged track examples of ChIP-Seq experiments from S2R+ cell extracts transfected with HA-tagged Mago, Y14, eIF4AIII, or Ctrl. Shown here is recruitment of pre-EJC components to an intronless (Sry-delta) and intron-containing (T48) genes. d Co-immunoprecipitation using anti-Flag antibody from cell extracts expressing either Flag-Mago or Flag alone (Flag-Ctrl), revealed with total Pol II, Ser5P and Ser2P antibodies. Note that Mago interacts with total Pol II, both hypo (IIA) and hyper phosphorylated (IIO) forms (indicated with the arrowheads). Mago also interacts with Ser5P but not with Ser2P, and this interaction with Pol II is partially dependent on RNA. e Heatmaps of HA-tagged pre-EJC components and change in total Pol II, centered at the TSS (−1 kb to +1 kb). Rows indicate all the genes bound by Pol II and are sorted by decreasing Pol II occupancy. The color labels to the right indicate the levels of enrichment. f Histogram showing percentage of pre-EJC bound genes amongst different quartiles of genes expressed in control condition. For quartile classification, all of the expressed genes in S2R+ cells were divided into four equal sized quartiles according to the level of expression, from low to high level. p-values for significance of the associations, derived from Fisher’s exact test, are shown on top of the histogram. g Log2 fold changes in Ser2P level at the TSS upon control and Mago knockdowns, when separated according to pre-EJC binding. p-value is derived from a two-sample t-test. h Recruitment of Mago at the 5ʹ end of RNA is sufficient to induce pausing. (Top) Schematic of the BoxB-λN tethering assay. BoxB sequences (blue rectangles) were inserted upstream of the CDS of Firefly luciferase (green rectangle). The λN peptide (blue) was fused to Mago (shown in red), GFP or RnpS1, and transfected into S2R+ cells along with the modified Firefly luciferase plasmid as well as with a Renilla luciferase construct. (Bottom) Quantification of the ChIP experiment. Chromatin was prepared for the different conditions and followed by immunoprecipitation using antibody directed against total Pol II. The enrichment of Pol II at the promoter and at the 3ʹ end of Firefly luciferase was calculated after normalizing against a negative loci and Renilla. The enrichment for three independent biological replicates is shown along with p-values for tested conditions
Fig. 3
Fig. 3
Mago controls chromatin accessibility. a Heatmaps of nucleosomal occupancy from MNase-seq experiments performed in biological duplicates from S2R+ cells in control or Mago knockdown conditions centered at the TSS in a ±1 Kb window. Rows indicate all the genes bound by Pol II and are sorted by decreasing Pol II occupancy. The color labels to the right indicate the levels of nucleosomal occupancy. Composite metagene profiles are also shown, with nucleosomal occupancy level on Y-axis and genomic coordinates on X-axis. b Genome browser view of averaged enrichment MNase-seq data from two independent biological duplicates in S2R+ cells treated with control or Mago double stranded RNA. The example shown here is Dbp80 gene, a well-defined pre-EJC target. c Log2 fold changes in nucleosomal occupancy at the TSS (250 bp upstream and downstream of TSS) after control and Mago knockdowns. The changes were separated according to pre-EJC binding and a two-sample t-test was performed. d Scatterplot between changes in nucleosome and Ser2P occupancy after either control or Mago knockdown. Pre-EJC-bound promoters are highlighted by orange color. A mild negative correlation, as shown in the indicated pearson coefficient of correlation, between nucleosome and Ser2P occupancies was found. e Log2 fold changes in K4Me3 levels normalized to the nucleosomal occupancy (MNase data) at the TSS (250 bp upstream and downstream of TSS), after control and Mago knockdowns. The changes were separated according to pre-EJC binding and a two-sample t-test was performed
Fig. 4
Fig. 4
Mago controls chromatin accessibility and Pol II pausing in a gene size dependent manner. a, b Changes in nucleosome occupancy (a) and Ser2P levels (b) in control and Mago knockdown in S2R+ cells at the promoter, gene body, and TES, separated according to the size of the largest intron (ANOVA, p < 2.2 × 10−16). c Box plots showing changes in PRRs upon Mago depletion when compared to control, separated into different intron classes. d Percentage of pre-EJC-bound genes in different intron classes, along with the percentage of each class amongst all the expressed genes. The proportion of pre-EJC-bound genes is increased for genes containing larger introns, relative to their abundance. p-values are derived from Fisher’s exact test. eg Venn diagrams showing the overlap between Mago-bound, Y14-bound, and eIF4A3-bound genes and genes with differential expression upon respective knockdowns. The overlap between genes that are downregulated upon each pre-EJC component knockdown, and their respective target genes is significant. p-values are derived from Fisher’s exact test. h Venn diagram showing the overlap between genes identified as differentially expressed in mRNA sequencing and nascent RNA sequencing (4sU-Seq) upon Mago KD. p-values are derived from Fisher’s exact test, separated for either upregulated or downregulated genes
Fig. 5
Fig. 5
Loss of pre-EJC core components results in increased Cdk9 binding to Pol II. a Metagene profiles of Cdk9-DamID in control and Mago knockdown cells as averaged enrichment over input from two independent biological replicates with standard error of the mean for all the expressed genes. Fold enrichment represented on Y-axis was calculated against Dam alone control in respective conditions (using damidseq_pipeline), while X-axis depicts scaled genomic coordinates. b Genome browser view of Dam alone normalized and averaged tracks of Cdk9-DamID for light and Rpl23A. c Heatmaps of changes in normalized Cdk9-DamID enrichment in Mago depleted S2R+ cells compared to control, centered at the TSS in a ±1.5 Kb window. Rows indicate all the genes bound by Pol II and are sorted by decreasing Pol II occupancy, and the color labels to the right indicate the level of enrichment. Heatmap of Mago-HA centered at the TSS (−1 kb to +1 kb) is also shown. d ChIP-qPCR analysis of Cdk9-HA occupancies at indicated MAPK locus. Error bars indicate the standard deviation of three biological replicates. e Changes in Cdk9 occupancy at the TSS (250 bp upstream and downstream of TSS) after control and Mago knockdowns, calculated from Cdk9-DamID experiment, after normalizing to the Dam alone control. The changes were separated according to pre-EJC binding and a two-sample t-test was performed. f Co-immunoprecipitation experiments from S2R+ cells extracts expressing either HA-SBP-Cdk9 or HA-SBP alone, revealed with Pol II Ser5P antibody. Immunoprecipitations were performed from control cells or cells depleted for pre-EJC core components (Mago, Y14, and elF4AIII). Shown also is the western blot against HA tag to assess the efficiency of the pull-down of HA-SBP-Cdk9 in each knockdown condition
Fig. 6
Fig. 6
Restoring pausing is sufficient to rescue Mago-associated exon skipping defects. a Mago knockdown results in elevated level of Ser2P phosphorylation of Pol II. Western blots using antibodies against Pol II Ser2P and Tubulin, using S2R+ cell extracts with indicated knockdowns. Signal in the knockdown conditions was normalized to the control condition using Tubulin as loading control and quantification of the intensity was performed with ImageJ. b ChIP-qPCR analysis of Ser2P occupancy level at MAPK locus in the indicated knockdowns. The primers used for the analysis are indicated in the scheme above. Bars indicate the 95% confidence interval from the mean of two biological replicates. c Agarose gels showing RT-PCR products for MAPK and RpL15 using RNA extracted from S2R+ cells with indicated knockdowns as template for cDNA synthesis. The primers used for the PCR 5ʹ and 3ʹ UTR of MAPK are shown in the scheme above. RT-PCR products for RpL15 from respective knockdown condition were used as loading control. d Replicate averaged RNA-Seq track examples of MAPK in several knockdown conditions. Mago KD results in several exon skipping events, which are rescued upon simultaneous knockdown of Cdk9. The exons skipped in Mago knockdown condition are highlighted by colored rectangles e Quantitative RT-PCR using RNA extracts derived from S2R+ cells with the indicated knockdowns. The amplicons were obtained using the same 5ʹ forward primer (E1) together with the reverse primers on respective exons, as shown in the scheme above. The level of exon skipping is compared to the control treatment, with RpL49 used for normalization. Bars indicate the 95% confidence interval from the mean of two biological replicates. f Box plots showing the log2 fold change in inclusion level of alternatively spliced exons in the indicated knockdowns (rMATS was used for the analysis). g Upper panel: Staining of eye imaginal discs from third instar larvae with indicated dsRNAs specifically expressed in the eye (using the ey-GAL4 driver). All photoreceptors are stained with anti-Elav antibody (purple), and R8 (the first class of photoreceptor to be specified) with anti-Senseless (green). Scale bar 50 μM. Lower panel: Adult eyes of a control fly and flies with indicated KD
Fig. 7
Fig. 7
The role of Mago on promoter proximal pausing is conserved in human. a Metagene profiles based on averaged enrichment over input from two independent biological replicates of total Pol II occupancies in control and Magoh-depleted HeLa cells with standard error of the mean for all the Pol II bound genes. Log2 fold changes against input control are shown on Y-axis while X-axis depicts scaled genomic coordinates. b Metagene profiles of averaged enrichment from two independent biological replicates of total Pol II occupancies in control and Magoh-depleted HeLa cells with standard error of mean for all the Pol II bound genes, centered at the TSS in a ±1 Kb window. Log2 fold changes against input control are shown on Y-axis while X-axis depicts genomic coordinates. c The ECDF plot of PRR in HeLa cells treated with either control or Magoh siRNA. p-value is derived from two-sample Kolmogorov–Smirnov test. d Track examples of total Pol II ChIP-Seq from HeLa cells extracts, after either control or Magoh knockdown. The tracks are the average of two independent biological replicates after input normalization. e Western blots performed using antibodies against total Pol II, Ser2P, Ser5P, and Magoh, in HeLa cells treated with either control or Magoh siRNA. Similar to Drosophila, the loss of Magoh leads to elevated level of Ser2P without affecting Ser5P. fh Co-immunoprecipitation of Magoh from HeLa cells extracts, using antibody directed against Magoh. Western blots using Pol II, Ser5P and Ser2P antibody reveal RNA-dependent interaction of Magoh with Pol II and Ser5P. There was no detectable interaction of Magoh with Ser2P. The specific bands for Pol II are highlighted by arrowheads in f. The lane labeled with “Lad” indicates ladder. i Co-immunoprecipitation of Cdk9 using anti-Cdk9 antibody from HeLa cells extracts treated with either control or Magoh siRNA. Western blot was performed with anti-Ser5P antibody. The quantification of the intensity was performed with ImageJ. j Model: The pre-EJC stabilizes Pol II pausing by restricting P-TEFb binding at promoter, and possibly by sequestering Cdk12. This activity is required for proper recognition of exons

References

    1. Brugiolo M, Herzel L, Neugebauer KM. Counting on co-transcriptional splicing. F1000Prime Rep. 2013;5:9. doi: 10.12703/P5-9. - DOI - PMC - PubMed
    1. Girard C, et al. Post-transcriptional spliceosomes are retained in nuclear speckles until splicing completion. Nat. Commun. 2012;3:994. doi: 10.1038/ncomms1998. - DOI - PubMed
    1. Khodor YL, et al. Nascent-seq indicates widespread cotranscriptional pre-mRNA splicing in Drosophila. Genes Dev. 2011;25:2502–2512. doi: 10.1101/gad.178962.111. - DOI - PMC - PubMed
    1. Tilgner H, et al. Deep sequencing of subcellular RNA fractions shows splicing to be predominantly co-transcriptional in the human genome but inefficient for lncRNAs. Genome Res. 2012;22:1616–1625. doi: 10.1101/gr.134445.111. - DOI - PMC - PubMed
    1. Bentley DL. Coupling mRNA processing with transcription in time and space. Nat. Rev. Genet. 2014;15:163–175. doi: 10.1038/nrg3662. - DOI - PMC - PubMed

Publication types

Substances