. 2019 Jan 31;10(1):518.
doi: 10.1038/s41467-019-08446-0.

Microglia are an essential component of the neuroprotective scar that forms after spinal cord injury

Affiliations

Microglia are an essential component of the neuroprotective scar that forms after spinal cord injury

Victor Bellver-Landete et al. Nat Commun. .

Abstract

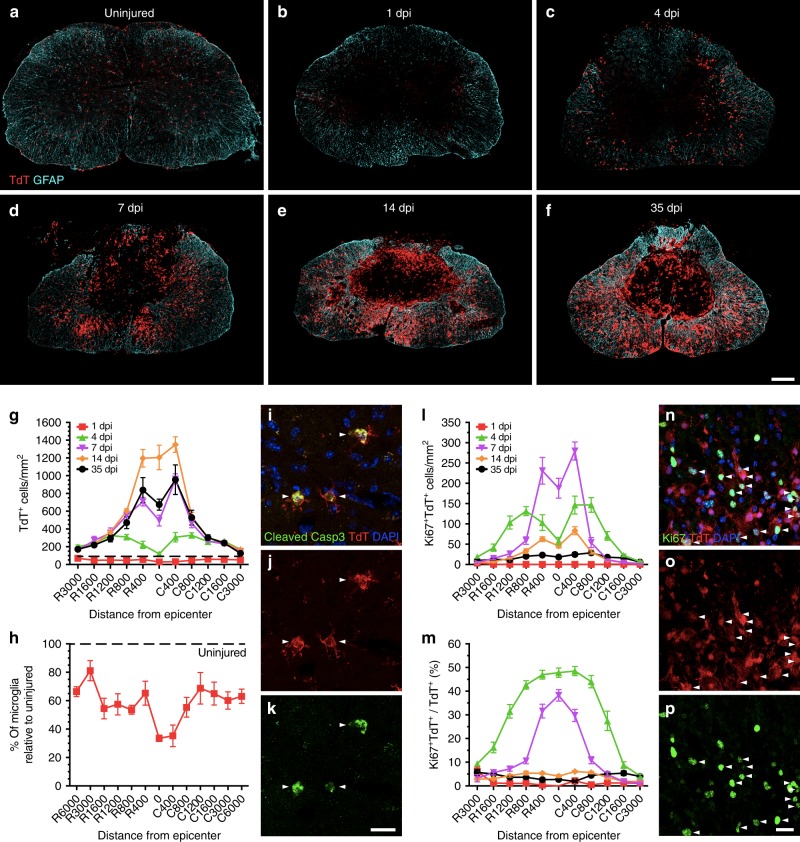
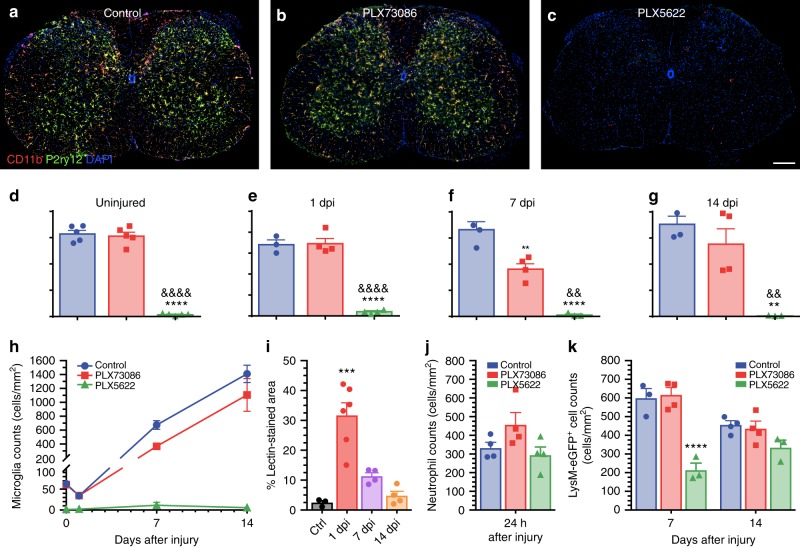
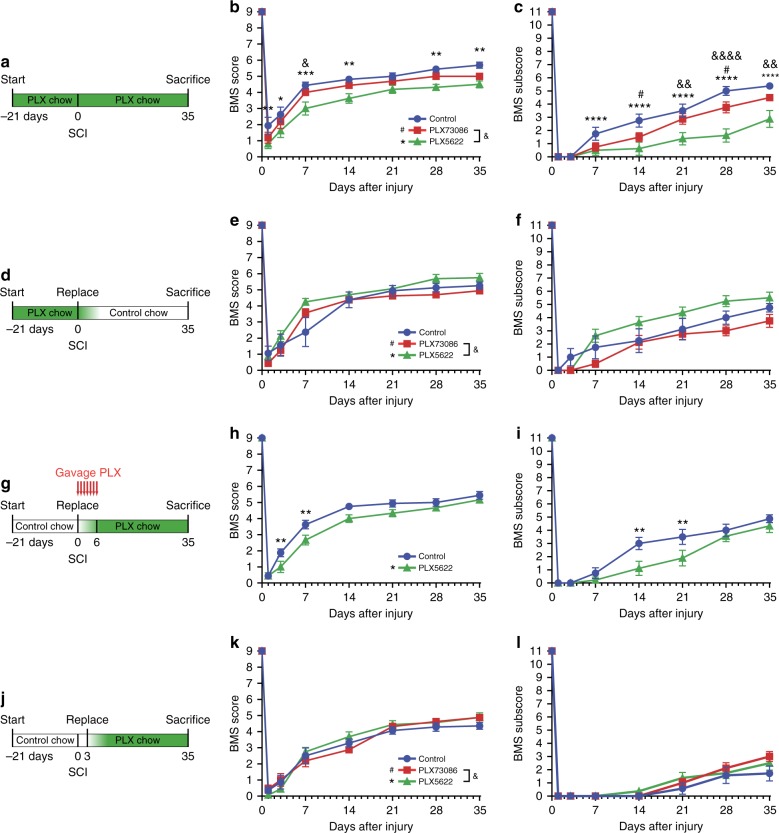
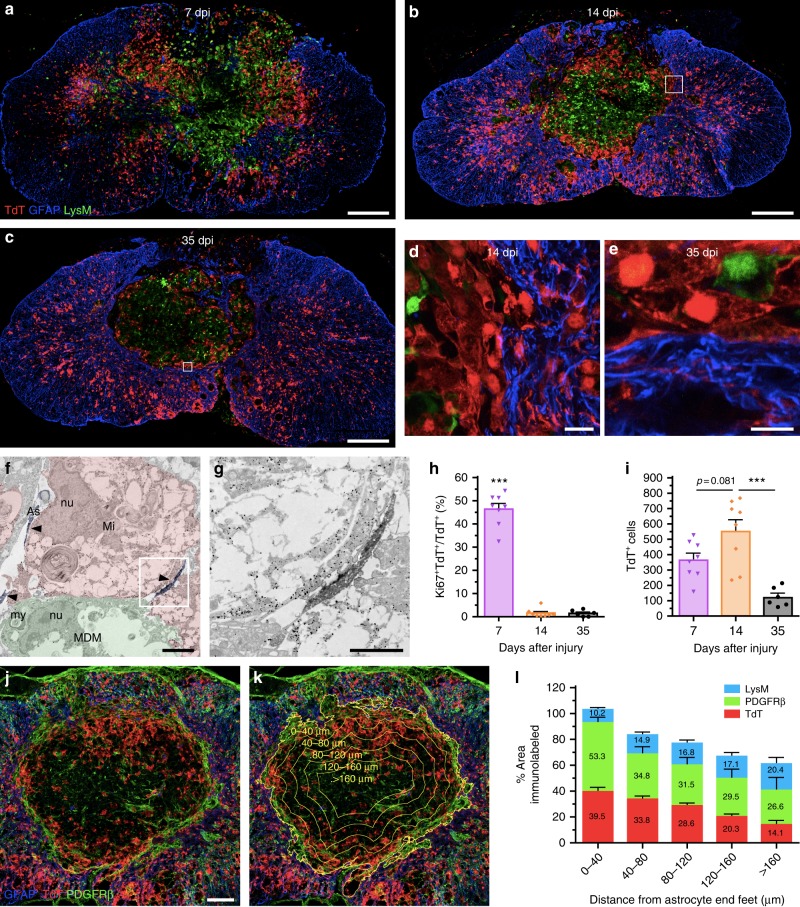
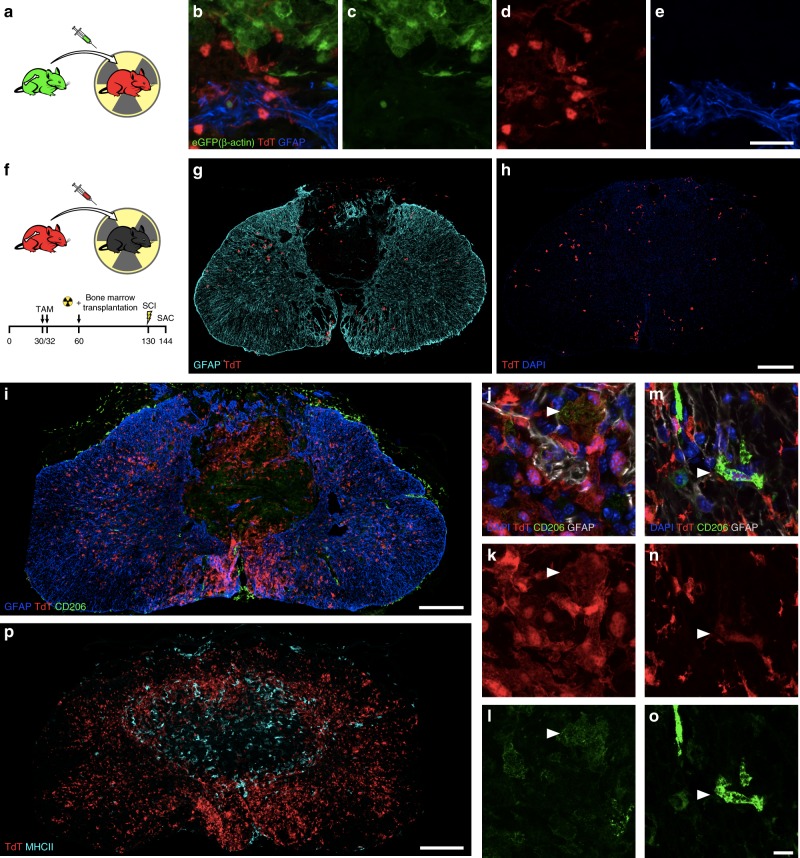
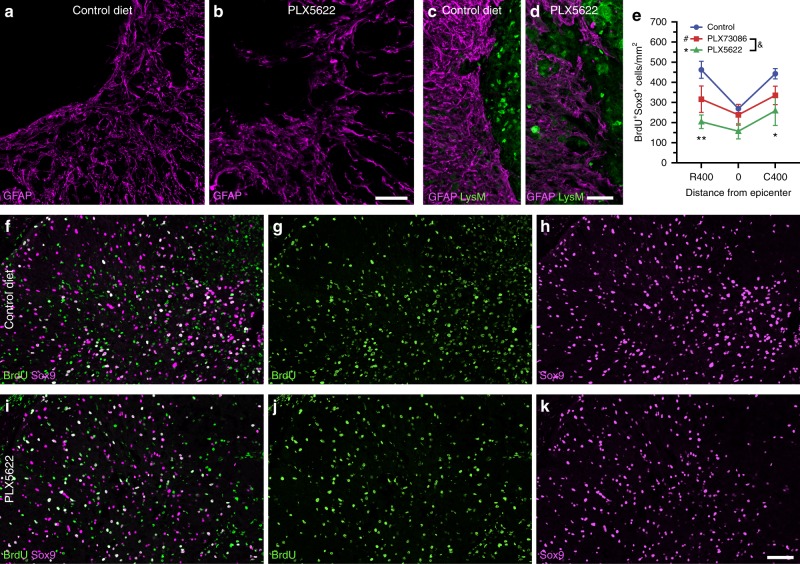
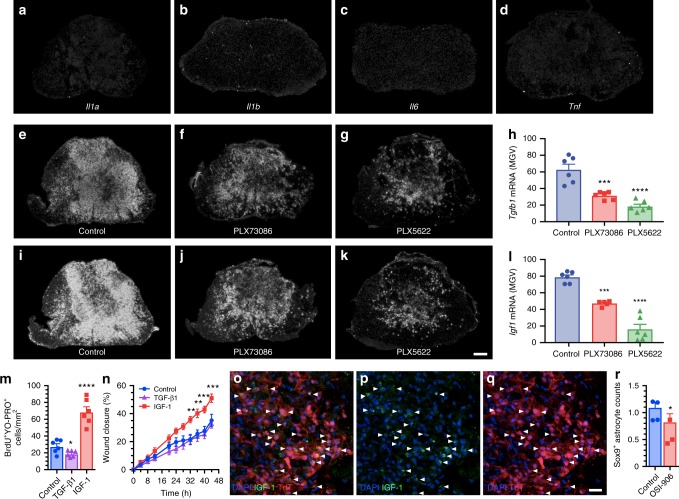
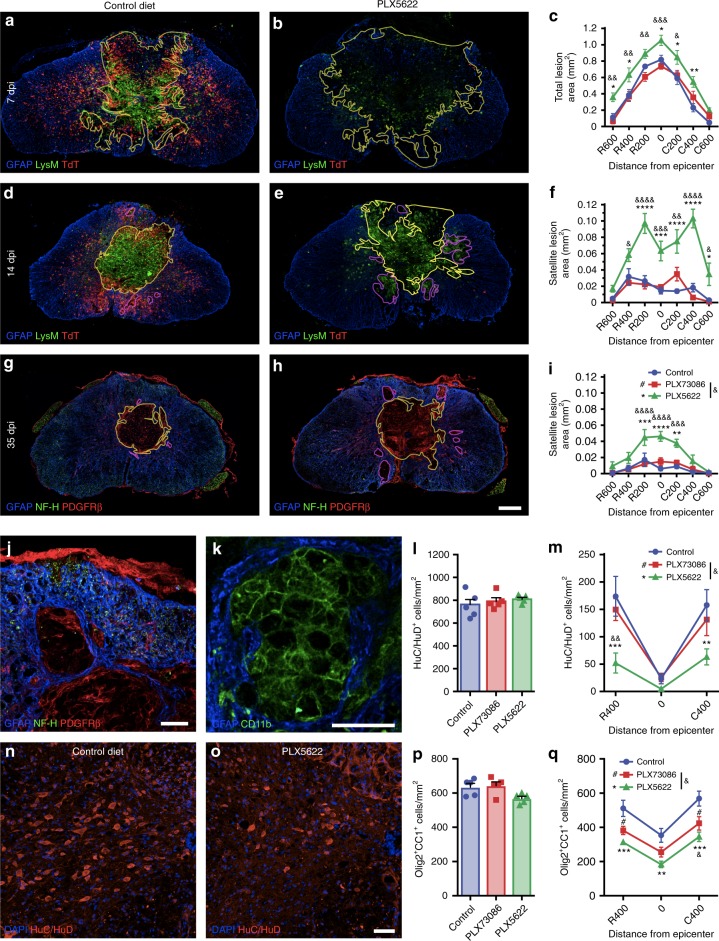
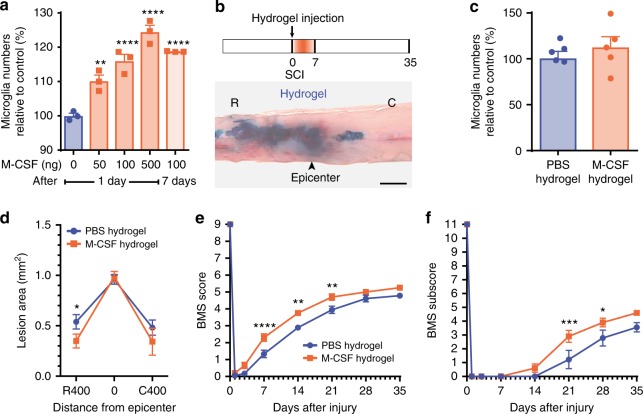
The role of microglia in spinal cord injury (SCI) remains poorly understood and is often confused with the response of macrophages. Here, we use specific transgenic mouse lines and depleting agents to understand the response of microglia after SCI. We find that microglia are highly dynamic and proliferate extensively during the first two weeks, accumulating around the lesion. There, activated microglia position themselves at the interface between infiltrating leukocytes and astrocytes, which proliferate and form a scar in response to microglia-derived factors, such as IGF-1. Depletion of microglia after SCI causes disruption of glial scar formation, enhances parenchymal immune infiltrates, reduces neuronal and oligodendrocyte survival, and impairs locomotor recovery. Conversely, increased microglial proliferation, induced by local M-CSF delivery, reduces lesion size and enhances functional recovery. Altogether, our results identify microglia as a key cellular component of the scar that develops after SCI to protect neural tissue.


Conflict of interest statement

The authors declare no competing interests.

Figures

Fig. 1
Fig. 1
Microglia proliferate extensively and accumulate at the lesion border after SCI. af Confocal immunofluorescence microscopy of representative spinal cord sections showing the spatio-temporal distribution of microglia (TdT, red) and astrocytes (GFAP, cyan) in an uninjured Cx3cr1creER::R26-TdT transgenic mouse (a), as well as at the lesion epicenter at 1 (b), 4 (c), 7 (d), 14 (e), and 35 (f) days post-injury (dpi). g Quantification of the total number of TdT+ microglia per mm2 of tissue in spinal cord sections taken both rostral (R) and caudal (C) to the lesion epicenter at 1 (red line), 4 (green), 7 (violet), 14 (orange), and 35 (black) dpi (n = 6–8 mice per group/time point). Data from uninjured mice are shown with the dotted black line. h Percentage of surviving TdT+ microglia at day 1 post-SCI relative to the uninjured group. ik Confocal immunofluorescence images showing expression of the apoptotic marker cleaved caspase-3 (Casp3, green) in TdT+ microglia (red) at 1 dpi. Nuclear staining (DAPI) is shown in blue, while white arrowheads indicate co-localization of cleaved Casp3, TdT, and DAPI. l Quantification of the number of actively proliferating microglia (TdT+ Ki67+ cells) at 1, 4, 7, 14, and 35 dpi (n = 7–8 mice per group). m Percentage of TdT+ microglia undergoing proliferation after SCI (n = 7–8 per group). np Confocal immunofluorescence microscopy showing that TdT+ microglia (red) are actively proliferating at 7 dpi, as demonstrated by their expression of the proliferation marker Ki67 (green). DAPI is shown in blue, while white arrowheads indicate co-localization of TdT, Ki67, and DAPI staining. Data are expressed as mean ± SEM. Scale bars: (af, in f) 200 µm; (ik, in k) 20 µm; (np, in p) 20 µm
Fig. 2
Fig. 2
The CSF1R inhibitor PLX5622, but not PLX73086, crosses the blood–spinal cord barrier to deplete virtually all microglia. ac Representative confocal images of CD11b and P2ry12 immunostainings showing the almost complete elimination of microglia in the spinal cord of naïve (uninjured) C57BL/6 mice after treatment with the CSF1R inhibitor PLX5622 compared to those fed PLX73086 or the control diet. Mice were killed after 21 days of treatment. dh Quantification of microglia in the spinal cord of uninjured C57BL/6 mice treated with PLX5622, PLX73086 or the control diet (d), as well as at the lesion epicenter in Cx3cr1creER::R26-TdT mice killed at 1 (e), 7 (f), and 14 (g) days post-injury (dpi) (n = 4–5 mice per group/time point). i Quantification of the proportional area of spinal cord tissue permeable to FITC-conjugated lectin injected intravenously prior to tissue fixation. j Quantification of Ly6G+ neutrophils at the lesion epicenter at day 1 post-SCI in mice treated with either PLX5622, PLX73086, or the control chow (n = 4–5 per group). k Quantification of the number of granulo-myelomonocytic cells at the lesion epicenter at 7 and 14 dpi in Cx3cr1creER::R26-TdT::LysM-eGFP mice treated with either PLX5622, PLX73086, or the control diet (n = 4–5 mice per group/time point). For all injured mice, treatment was initiated 3 weeks before SCI and continued until sacrifice. Data are expressed as mean ± SEM. **p < 0.01, ***p < 0.001, ****p < 0.0001, PLX5622 or 1 dpi compared to the control group; and &&p < 0.01, &&&&p < 0.0001, PLX5622 compared with the PLX73086 group. Statistical analysis was performed using a one-way (dg, i, j) or two-way (k) ANOVA followed by a Bonferroni’s post hoc test. Scale bar: (ac, in c) 200 µm
Fig. 3
Fig. 3
Microglia play a key role in recovery of locomotor function during the first week post-SCI. a, d, g, j Schematics of experimental design showing the timeline of microglia depletion, spinal cord contusion, behavioral testing using the Basso Mouse Scale (BMS), and sacrifice. CSF1R inhibitors and vehicle were administered in the diet or by oral gavage, as indicated. b and c, e and f, h and i, k and l Locomotor function was assessed using the BMS score (b, e, h, k) and BMS subscore (c, f, i, l) over a 35-day period after SCI (n = 8 mice per group). Data are expressed as mean ± SEM. *p < 0.05, **p < 0.01, ***p < 0.001, ****p < 0.0001, PLX5622 versus the control group; #p < 0.05, PLX73086 versus the control group; and &p < 0.05, &&p < 0.01, &&&&p < 0.0001, PLX5622 compared to PLX73086. Statistical analysis was performed using a two-way repeated-measures ANOVA followed by a Bonferroni’s post hoc test
Fig. 4
Fig. 4
A microglial scar forms at the interface between the astrocytic and fibrotic scars. ae Confocal immunofluorescence microscopy of representative spinal cord sections taken at the lesion epicenter at 7 (a), 14 (b, d), and 35 (c, e) days post-injury (dpi) showing formation of the microglial scar, characterized by the accumulation of TdT+ microglia (red) at the lesion borders, over time. The microglial scar is shown in relation to the infiltration of blood-derived myeloid cells (LysM-eGFP+, green) and formation of the astroglial scar (GFAP-immunoreactive astrocytes, blue). Panels (d) and (e) are insets of panels (b) and (c), respectively, showing close-ups of the microglial scar in Cx3cr1creER::R26-TdT::LysM-eGFP mice at 14 and 35 dpi. f and g Immunoelectron microscopy images showing a gold-labeled microglia (Mi) (dense black dots, highlighted in red) located at the lesion border making direct contacts with immunolabeled astrocytic endfeet (As) (diffuse black, highlighted in blue and pointed by arrowheads) and a monocyte-derived macrophage (MDM, highlighted in green). The intimate relationship between the microglia and distal astrocytic processes is shown at high magnification in the inset (g). nu = nucleus, my = myelin debris. h Percentage of microglia (TdT+) that are actively proliferating (Ki67+ TdT+) at the lesion epicenter at 7, 14, and 35 dpi. i Counts of microglia (TdT+) at the lesion epicenter at 7, 14, and 35 dpi. j and k Confocal images showing the presence of TdT+ microglia (red), PDGFRβ+ pericytes/fibroblasts (green) and GFAP+ astrocytes (blue) at the lesion epicenter at 14 dpi. The distance from astrocyte endfeet is depicted by the yellow lines and indicated (k). l Percentage area occupied by microglia (TdT+, red bars in the histogram), pericytes/fibroblasts (PDGFRβ, green), and blood-derived myeloid cells (LysM-eGFP+, blue) as a function of distance from astrocyte endfeet (n = 4–9 mice). Data are expressed as mean ± SEM. *p < 0.05, **p < 0.01, ***p < 0.001, compared to the other time points. Statistical analysis was performed using a one-way ANOVA followed by a Bonferroni’s post hoc test. Scale bars: (ac) 200 µm; (d and e) 20 µm; (f) 5 µm; (g) 2 µm; (j and k) 100 µm
Fig. 5
Fig. 5
The microglial scar is mainly composed of microglia, with few scattered blood-derived myeloid cells and CNS border-associated macrophages. a Schematic diagram showing the protocol used to generate radiation bone marrow chimeras in which microglia express TdT and bone marrow-derived cells the GFP reporter. be Representative confocal images showing the microglial scar formed of TdT+ microglia (red), some of which are in close apposition with GFAP-immunoreactive astrocyte endfeet (blue) on one side and bone marrow-derived cells (eGFP+, green) on the other side at 14 days post-SCI. f Schematic of experimental procedure and timeline to generate bone marrow chimeras in which Cx3cr1creER::R26-TdT mice were used as bone marrow donors for irradiated recipient C57BL/6 mice. g and h Representative confocal images showing the virtual absence of bone marrow-derived TdT+ cells (red) medial to the astrocytic scar (as defined by GFAP+ astrocyte endfeet in blue), where the microglial scar normally develops, at 14 days post-SCI in Cx3cr1creER::R26-TdT → WT chimeric mice. io Confocal images showing the absence (or very weak expression) of CD206 (green) in microglia (TdT+, red) forming the microglial scar at the lesion borders at 14 days post-SCI. In contrast, border-associated macrophages express high levels of the CD206 protein. p Representative confocal image showing the absence of colocalization between TdT (red) and MHCII (cyan) in the injured spinal cord of a Cx3cr1creER::R26-TdT mouse at 14 days. Scale bars: (be, in e) 20 µm, (g and h, in h) 200 µm, (i, p) 200 µm, (jo, in o) 10 µm
Fig. 6
Fig. 6
The elimination of microglia results in a reduced proliferation of astrocytes and disorganized astrocytic scar at the lesion border. ad Confocal immunofluorescence microscopy of astrocytes (GFAP, purple) in spinal cord sections taken at the lesion epicenter in Cx3cr1creER::R26-TdT::LysM-eGFP mice at 14 days post-injury (dpi). In mice fed with the control diet (a, c), astrocytes adjacent to the site of SCI exhibit elongated processes oriented parallel to the lesion border, thus forming a compact scar. This astrocytic response was compromised in mice depleted of microglia using PLX5622 (b, d), and associated with clusters of blood-derived myeloid cells (LysM-eGFP+, green cells in d) spreading outside of the lesion core. e Total counts of Sox9+ BrdU+ cells at the epicenter and both rostral (R) and caudal (C) to the lesion at 7 dpi in mice fed the control diet (blue), PLX73086 (red) or PLX5622 (green) (n = 4 mice per group). fk Representative confocal images showing the proliferation of astrocytes (Sox9+, purple  cells), as demonstrated by their incorporation of BrdU (green cells), in mice treated with PLX5622 (fh) or the control diet (ik) and killed at 7 dpi. Data are expressed as mean ± SEM. *p < 0.05, **p < 0.01, PLX5622 versus the control group. Statistical analysis was performed using a two-way ANOVA followed by a Bonferroni’s post hoc test. Scale bars: (a and b, in b) 50 µm, (c and d, in d) 50 µm, (fk, in k) 50 µm
Fig. 7
Fig. 7
Microglia-derived IGF-1 is a potent mitogen for astrocytes and inducer of astrocytic migration towards an injured area. ad In situ hybridization (ISH) signal for the proinflammatory cytokines IL-1α, IL-1β, IL-6, and TNF in the injured mouse spinal cord (lesion epicenter) at 7 days post-SCI (dpi). eg, ik Representative darkfield photomicrographs showing expression of Tgfb1 and Igf1 mRNAs at the lesion epicenter at 7 dpi in C57BL/6 mice fed the control diet, PLX73086 or PLX5622. h, l Quantification of ISH signal (in mean grey values, MGV) for TGF-β1 (h) and IGF-1 (l) at the lesion epicenter in mice treated with vehicle (Control, blue bars), PLX73086 (red bars) or PLX5622 (green bars) (n = 6 per group). m Quantification of the number of BrdU+ YO-PRO-1+ nuclear profiles following treatment of primary astrocyte cultures with either TGF-β1, IGF-1 or control solution (n = 6 per group). n Quantification of the wound closure response in the different groups (n = 6 per group). oq Representative immunofluorescence images showing the expression of IGF-1 (green signal, o, p) by TdT+ microglia (red cells, o and q) accumulating at the lesion border at 7 dpi. White arrowheads indicate co-localization of IGF-1, TdT, and DAPI (blue). r Quantification of Sox9+ astrocytes, expressed as the AUC of the total number of Sox9+ cells (×103 per mm3) from 800 µm rostral to 800 µm caudal to the epicenter, in the injured spinal cord of C57BL/6 mice treated with the IGF-1R antagonist OSI-906 (red bar) or the vehicle solution (Control, blue bar) (n = 4 per group). Data are expressed as mean ± SEM. *p < 0.05, **p < 0.01, ***p < 0.001, ****p < 0.0001, compared to the control group. Statistical analysis was performed using either a one-way (h, l, and m) or two-way (n) ANOVA followed by a Bonferroni’s post hoc test, or a Student’s t-test (r). Scale bars: (ag and ik, in k) 200 µm, (oq, in q) 20 µm
Fig. 8
Fig. 8
Microglial depletion results in an increased loss of neurons and oligodendrocytes leading to greater tissue damage after SCI. (a and b, d and e, g and h, j and k) Confocal immunofluorescence of astrocytes (GFAP+, blue), microglia (TdT+, red cells in ab, d and e), blood-derived myeloid cells (LysM-eGFP+ or CD11b+, green cells in a and b, d and e, k), neurons/axons (NF-H+, green in g and h, j) and pericytes/fibroblasts (PDGFRβ+, red cells in g and h, j) at the lesion epicenter at 7 (a and b), 14 (d and e) and 35 (g and h) dpi. Yellow and purple lines, respectively, delineate the contours of the primary (core) and satellite lesions, which were surrounded by astrocytic endfeet and characterized by the absence of neuronal elements and presence of cells of non-CNS origin (blood-derived myeloid cells, pericytes, and fibroblasts). Satellite lesions are shown in a microglia-depleted mouse at 35 dpi (j and k). c Quantification of the total lesion area at 7 dpi in mice fed the control diet (blue), PLX73086 (red), or PLX5622 (green) (n = 5–6 mice/group). f, i Quantification of the total area occupied by satellite lesions at 14 (f) and 35 (i) dpi (n = 5–7/group). l and m Quantification of the number of neurons (HuC/HuD+) in the uninjured spinal cord (l), as well as rostral (R) and caudal (C) to the epicenter (m), in mice treated with PLX5622, PLX73086, or control at 35 dpi (n = 5–8/group). n and o Representative confocal images taken at the lesion epicenter at 35 dpi immunostained for HuC/HuD (red). DAPI is shown in blue. p, q Quantification of the number of oligodendrocytes (Olig2+ CC1+) in the uninjured (p) and injured (q) spinal cord of mice treated with PLX5622, PLX73086 or control at 35 dpi (n = 5–8/group). Data are expressed as mean ± SEM. *p < 0.05, **p < 0.01, ***p < 0.001, ****p < 0.0001, PLX5622 versus control; #p < 0.05, PLX73086 versus control; and &p < 0.05, &&p < 0.01, &&&p < 0.001, &&&&p < 0.0001, PLX5622 compared to PLX73086. Statistical analysis was performed using a two-way ANOVA followed by a Bonferroni’s post hoc test. Scale bars: (a and b, d and e, g and h in h) 200 µm, (j and k) 50 µm, (n and o, in o) 50 µm
Fig. 9
Fig. 9
Hydrogel delivery of M-CSF at the site of SCI boosted microglial proliferation and enhanced functional recovery. a Quantification of the number of microglia (CD11b+ P2ry12+) in the thoracic spinal cord following intra-cisterna magna injection of recombinant murine M-CSF at various doses (n = 3 mice per group). b Schematic of the experimental design showing the timeline of spinal cord contusion (SCI), hydrogel injection, behavioral testing using the Basso Mouse Scale (BMS), and sacrifice. Below the schematic is a picture showing how much a hydrogel loaded with Evans blue spreads following subdural injection at the site of SCI. c Quantification of the number of microglia (TdT+) at the lesion epicenter at 7 days post-injury (dpi) in Cx3cr1creER::R26-TdT mice treated with either M-CSF-based (orange bar) or PBS-based (blue) hydrogels (n = 5 mice per group). d Quantitative analysis of the total lesion area at the lesion epicenter and both rostral (R) and caudal (C) at 7 dpi in mice treated with M-CSF (orange) or PBS (blue) in hydrogels (n = 9–15 mice per group). e and f Assessment of locomotor recovery using the BMS (e) and BMS subscore (f) showed that hydrogel delivery of M-CSF increased functional recovery after SCI (n = 9–10 mice per group). Data are expressed as mean ± SEM. *p < 0.05, **p < 0.01, ***p < 0.001, ****p < 0.0001, M-CSF-loaded hydrogel compared with PBS-loaded hydrogel. Statistical analysis was performed using a one-way (a, c), two-way (d), or two-way repeated-measures (e and f) ANOVA followed by a Bonferroni’s post hoc test

References

    1. Ginhoux F, et al. Fate mapping analysis reveals that adult microglia derive from primitive macrophages. Science. 2010;330:841–845. doi: 10.1126/science.1194637. - DOI - PMC - PubMed
    1. Schulz C, et al. A lineage of myeloid cells independent of Myb and hematopoietic stem cells. Science. 2012;336:86–90. doi: 10.1126/science.1219179. - DOI - PubMed
    1. Kierdorf K, et al. Microglia emerge from erythromyeloid precursors via Pu.1- and Irf8-dependent pathways. Nat. Neurosci. 2013;16:273–280. doi: 10.1038/nn.3318. - DOI - PubMed
    1. Askew K, et al. Coupled proliferation and apoptosis maintain the rapid turnover of microglia in the adult brain. Cell Rep. 2017;18:391–405. doi: 10.1016/j.celrep.2016.12.041. - DOI - PMC - PubMed
    1. Tay TL, et al. A new fate mapping system reveals context-dependent random or clonal expansion of microglia. Nat. Neurosci. 2017;20:793–803. doi: 10.1038/nn.4547. - DOI - PubMed

Publication types

Substances