

Distinguishing core from penumbra by lipid profiles using Mass Spectrometry Imaging in a transgenic mouse model of ischemic stroke
- PMID: 30705295
- PMCID: PMC6355923
- DOI: 10.1038/s41598-018-37612-5
Distinguishing core from penumbra by lipid profiles using Mass Spectrometry Imaging in a transgenic mouse model of ischemic stroke
Abstract
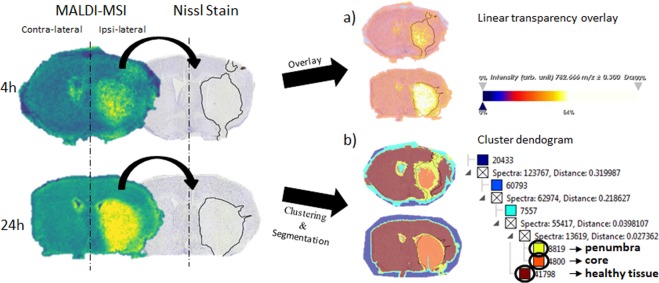
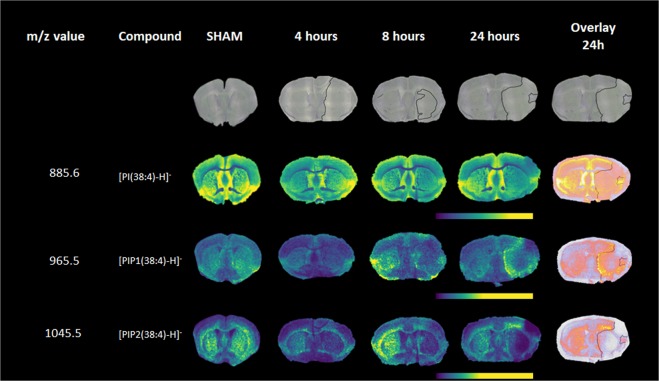
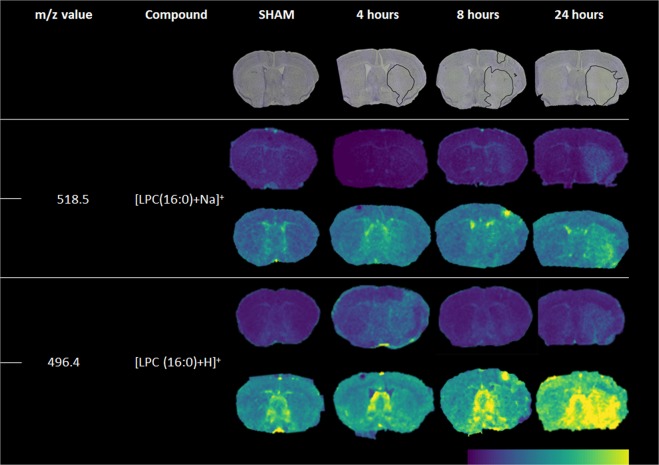
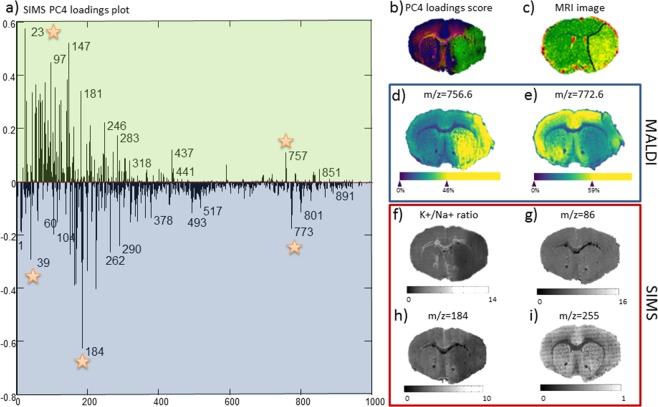
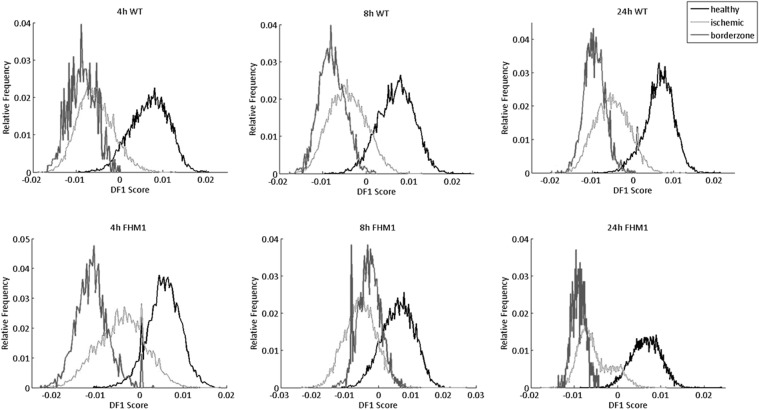
Detecting different lipid profiles in early infarct development may give an insight on the fate of compromised tissue. Here we used Mass Spectrometry Imaging to identify lipids at 4, 8 and 24 hours after ischemic stroke in mice, induced by transient middle cerebral artery occlusion (tMCAO). Combining linear transparency overlay, a clustering pipeline and spatial segmentation, we identified three regions: infarct core, penumbra (i.e. comprised tissue that is not yet converted to core), and surrounding healthy tissue. Phosphatidylinositol 4-phosphate (m/z = 965.5) became visible in the penumbra 24 hours after tMCAO. Infarct evolution was shown by 2D-renderings of multiple phosphatidylcholine (PC) and Lyso-PC isoforms. High-resolution Secondary Ion Mass Spectrometry, to evaluate sodium/potassium ratios, revealed a significant increase in sodium and a decrease in potassium species in the ischemic area (core and penumbra) compared to healthy tissue at 24 hours after tMCAO. In a transgenic mouse model with an enhanced susceptibility to ischemic stroke, we found a more pronounced discrimination in sodium/potassium ratios between penumbra and healthy regions. Insight in changes in lipid profiles in the first hours of stroke may guide the development of new prognostic biomarkers and novel therapeutic targets to minimize infarct progression.
Conflict of interest statement
The authors declare no competing interests.
Figures
Similar articles
-
Perfusion computed tomography thresholds defining ischemic penumbra and infarct core: studies in a rat stroke model.Int J Stroke. 2015 Jun;10(4):553-9. doi: 10.1111/ijs.12147. Epub 2013 Oct 21. Int J Stroke. 2015. PMID: 24138577
-
Sodium-23 magnetic resonance imaging has potential for improving penumbra detection but not for estimating stroke onset time.J Cereb Blood Flow Metab. 2015 Jan;35(1):103-10. doi: 10.1038/jcbfm.2014.174. Epub 2014 Oct 22. J Cereb Blood Flow Metab. 2015. PMID: 25335803 Free PMC article.
-
SB 234551 selective ET(A) receptor antagonism: perfusion/diffusion MRI used to define treatable stroke model, time to treatment and mechanism of protection.Exp Neurol. 2008 Jul;212(1):53-62. doi: 10.1016/j.expneurol.2008.03.011. Epub 2008 Mar 25. Exp Neurol. 2008. PMID: 18462720
-
Evolving paradigms for neuroprotection: molecular identification of ischemic penumbra.Cerebrovasc Dis. 2006;21 Suppl 2:71-9. doi: 10.1159/000091706. Epub 2006 May 2. Cerebrovasc Dis. 2006. PMID: 16651817 Review.
-
Refining the ischemic penumbra with topography.Int J Stroke. 2018 Apr;13(3):277-284. doi: 10.1177/1747493017743056. Epub 2017 Nov 15. Int J Stroke. 2018. PMID: 29140184 Review.
Cited by
-
Exploring Lysophosphatidylcholine as a Biomarker in Ischemic Stroke: The Plasma-Brain Disjunction.Int J Mol Sci. 2024 Oct 3;25(19):10649. doi: 10.3390/ijms251910649. Int J Mol Sci. 2024. PMID: 39408978 Free PMC article.
-
Mass spectrometry-based spatiotemporal characterization of lipids in early focal cerebral ischemia.Anal Bioanal Chem. 2025 Aug;417(20):4649-4662. doi: 10.1007/s00216-025-05981-2. Epub 2025 Jun 27. Anal Bioanal Chem. 2025. PMID: 40576762
-
Ischemic Stroke Causes Disruptions in the Carnitine Shuttle System.Metabolites. 2023 Feb 14;13(2):278. doi: 10.3390/metabo13020278. Metabolites. 2023. PMID: 36837897 Free PMC article.
-
Changes in Plasma Lipid Levels Following Cortical Spreading Depolarization in a Transgenic Mouse Model of Familial Hemiplegic Migraine.Metabolites. 2022 Mar 1;12(3):220. doi: 10.3390/metabo12030220. Metabolites. 2022. PMID: 35323663 Free PMC article.
-
MALDI imaging mass spectrometry: an emerging tool in neurology.Metab Brain Dis. 2022 Jan;37(1):105-121. doi: 10.1007/s11011-021-00797-2. Epub 2021 Aug 4. Metab Brain Dis. 2022. PMID: 34347208 Review.
References
-
- Mozaffarian D, et al. Heart disease and stroke statistics–2015 update: a report from the American Heart Association. Circulation. 2015;131:e29–322. - PubMed
Publication types
MeSH terms
Substances
LinkOut - more resources
Full Text Sources
Medical
