. 2019 Jan 31;9(1):1041.
doi: 10.1038/s41598-018-37603-6.

North Atlantic Ocean Circulation and Decadal Sea Level Change During the Altimetry Era

Affiliations

North Atlantic Ocean Circulation and Decadal Sea Level Change During the Altimetry Era

Léon Chafik et al. Sci Rep. .

Abstract

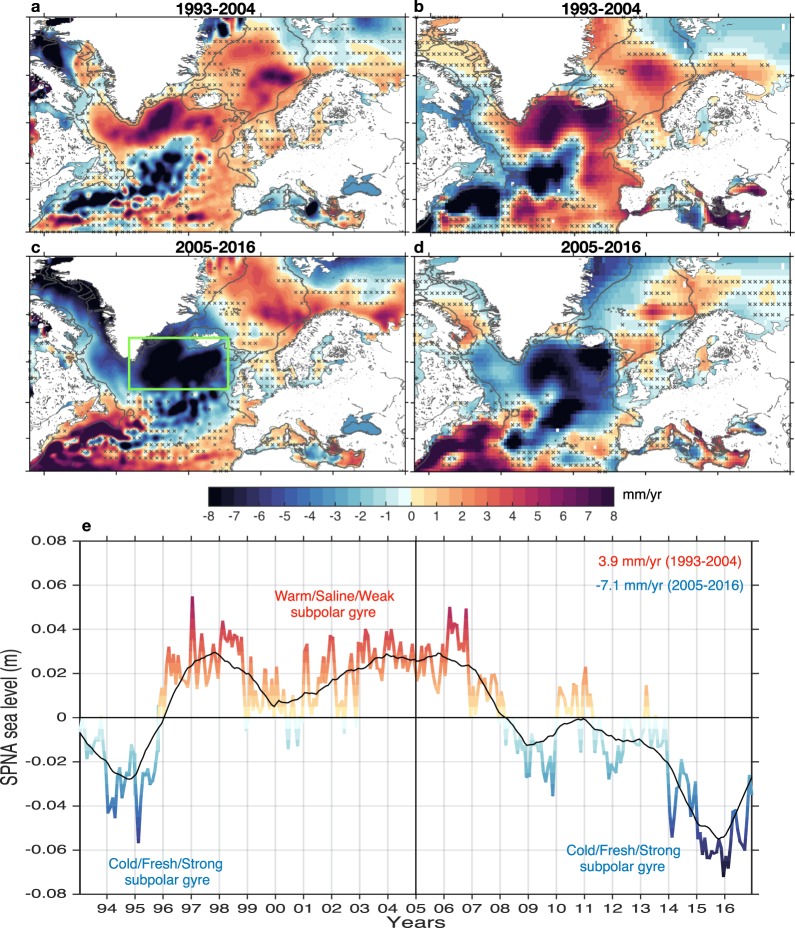
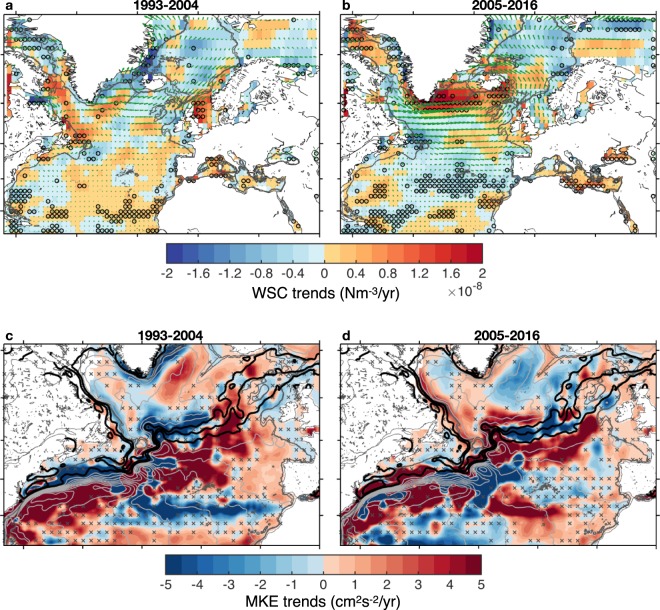
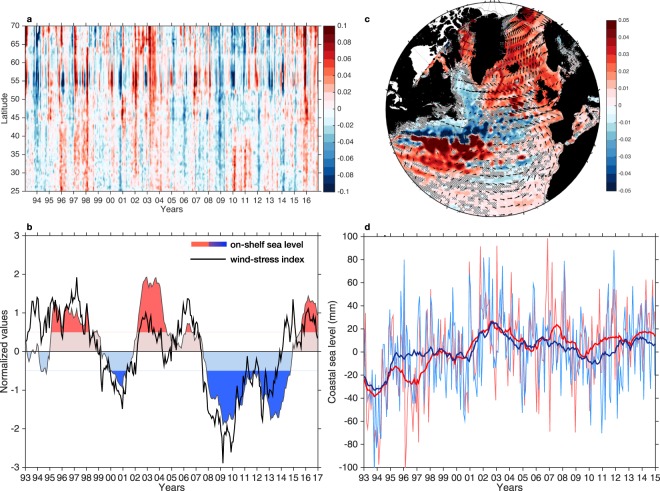
Regional sea-level rise is characterized by decadal acceleration and deceleration periods that typically stem from oceanic climate variability. Here, we investigate decadal sea-level trends during the altimetry era and pin down the associated ocean circulation changes. We find that decadal subpolar gyre cooling (warming), strengthening (weakening), widening (shrinking) since the mid-2000s (early 1990s) resulted in negative (positive) sea level trends of -7.1 mm/yr ± 1.3 mm/yr (3.9 mm/yr ± 1.5 mm/yr). These large-scale changes further coincide with steric sea-level trends, and are driven by decadal-scale ocean circulation variability. Sea level on the European shelf, however, is found to correlate well with along-slope winds (R = 0.78), suggesting it plays a central role in driving the associated low-frequency dynamic sea level variability. Furthermore, when the North Atlantic is in a cooling (warming) period, the winds along the eastern boundary are predominantly from the North (South), which jointly drive a slowdown (rapid increase) in shelf and coastal sea level rise. Understanding the mechanisms that produce these connections may be critical for interpreting future regional sea-level trends.


Conflict of interest statement

The authors declare no competing interests.

Figures

Figure 1
Figure 1
Regional dynamic and steric sea level trends in the North Atlantic Ocean. The dynamic and steric sea level trends (mm/yr) as deduced from altimetry and EN4 hydrographic dataset, respectively, for the (a,b) 1993–2004 and (c,d) 2005–2016 periods. The global mean sea-level and steric height trend of each period have been removed before calculating the regional trends. The stipplings indicate the non-significant regions at the 95% confidence level using the modified Mann-Kendall test. The gray contours in all panels depict the 500 and 1000-m isobaths. (e) The averaged monthly dynamic sea level in the SPNA [45°W–5°W, 55°N–65°N] (see box in panel c) as calculated from altimetry. The global mean sea level (Fig. S1) has been removed beforehand. The black line is the smoothed SPNA sea level using a 25-month running mean in order to represent interannual-to-decadal timescales. Anomalously high/low sea levels do not only represent warming/cooling of the upper ocean but also the strength of the subpolar gyre. The figure was produced using the software Matlab R2014b, (https://www.mathworks.com).
Figure 2
Figure 2
Atmospheric-driven ocean changes. Trends of wind-stress curl (WSC) calculated using NCEP/NCAR reanalysis for (a) the 1993–2004 WP and (b) the 2005–2016 CP. The vectors in the upper panels represent the wind-stress trends. The circles in the upper panels indicate the regions that are significant at the 95% confidence level. Trends of mean kinetic energy (MKE) calculated using altimetry for (c) the 1993–2004 WP and (d) the 2005–2016 CP. The stipplings indicate the non-significant regions at the 95% confidence level. The light grey contours depict the time-invariant mean dynamic topography (CNES-CLS2013 MDT) that ranges from 0.8 m to −0.8 m with a spacing of 0.1 m. Three of these contours (−0.1, −0.2 and −0.3 m) are highlighted in black as they trace the different branches of the NAC that continue into the northeast Atlantic. The gray contours in all panels depict the 500 and 1000-m isobaths. The figure was produced using the software Matlab R2014b, (https://www.mathworks.com).
Figure 3
Figure 3
Low-frequency dynamic shelf sea level variability. (a) Time-latitude diagram of regional dynamic shelf sea level variability in the eastern Atlantic with no smoothing applied. (b) Averaged regional dynamic sea-level variability over the east Atlantic shelf (shallower than the 500-m isobath) calculated from altimetry for the 1993–2016 period (shading) overlaid by the latitudinally-averaged along-slope wind-stress (black). The time series have been deseasoned, smoothed with a 25-month running mean and normalized. Dark blue and red indicate anomalous periods (higher and lower than 0.5 standard deviation). (c) Composite analysis of sea level (shading) and wind-stress (vectors) calculated based on the difference between the anomalously high and low dynamic shelf sea-level periods shown in panel (a) but excluding the first and last year due to smoothing effects. (d) Monthly (thin lines) and smoothed (thick lines) relative sea-level variability from tide gauges in the North (red) and Norwegian (blue) Seas. The figure was produced using the software Matlab R2014b, (https://www.mathworks.com).

References

    1. Nicholls RJ, Cazenave A. Sea-level rise and its impact on coastal zones. Sci. 2010;328:1517–1520. doi: 10.1126/science.1185782. - DOI - PubMed
    1. Church JA, et al. Sea-level rise by 2100. Sci. 2013;342:1445–1445. doi: 10.1126/science.342.6165.1445-a. - DOI - PubMed
    1. Dangendorf S, et al. Reassessment of 20th century global mean sea level rise. Proc. Natl. Acad. Sci. 2017;114:5946–5951. doi: 10.1073/pnas.1616007114. - DOI - PMC - PubMed
    1. Hamlington B, Leben R, Strassburg M, Nerem R, Kim K-Y. Contribution of the Pacific Decadal Oscillation to global mean sea level trends. Geophys. Res. Lett. 2013;40:5171–5175. doi: 10.1002/grl.50950. - DOI
    1. Stammer D, Cazenave A, Ponte RM, Tamisiea ME. Causes for contemporary regional sea level changes. Annu. Rev. Mar. Sci. 2013;5:21–46. doi: 10.1146/annurev-marine-121211-172406. - DOI - PubMed

Publication types