. 2019 Jan 31;9(1):1076.
doi: 10.1038/s41598-018-37741-x.

A feasibility study for predicting optimal radiation therapy dose distributions of prostate cancer patients from patient anatomy using deep learning

Affiliations

A feasibility study for predicting optimal radiation therapy dose distributions of prostate cancer patients from patient anatomy using deep learning

Dan Nguyen et al. Sci Rep. .

Abstract

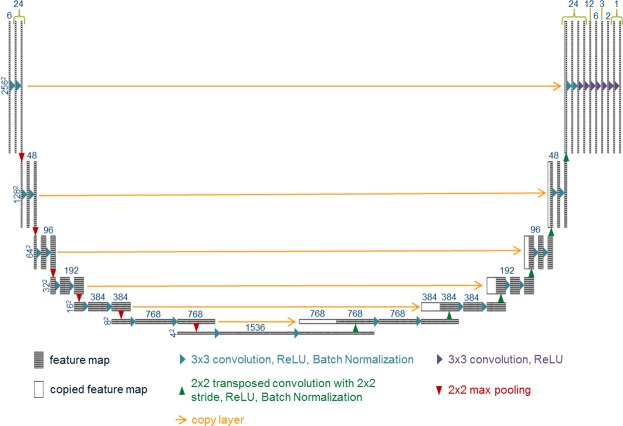
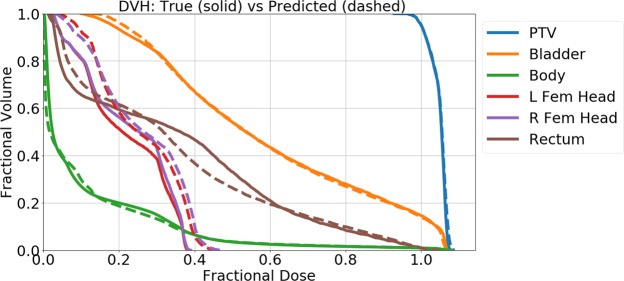
With the advancement of treatment modalities in radiation therapy for cancer patients, outcomes have improved, but at the cost of increased treatment plan complexity and planning time. The accurate prediction of dose distributions would alleviate this issue by guiding clinical plan optimization to save time and maintain high quality plans. We have modified a convolutional deep network model, U-net (originally designed for segmentation purposes), for predicting dose from patient image contours of the planning target volume (PTV) and organs at risk (OAR). We show that, as an example, we are able to accurately predict the dose of intensity-modulated radiation therapy (IMRT) for prostate cancer patients, where the average Dice similarity coefficient is 0.91 when comparing the predicted vs. true isodose volumes between 0% and 100% of the prescription dose. The average value of the absolute differences in [max, mean] dose is found to be under 5% of the prescription dose, specifically for each structure is [1.80%, 1.03%](PTV), [1.94%, 4.22%](Bladder), [1.80%, 0.48%](Body), [3.87%, 1.79%](L Femoral Head), [5.07%, 2.55%](R Femoral Head), and [1.26%, 1.62%](Rectum) of the prescription dose. We thus managed to map a desired radiation dose distribution from a patient's PTV and OAR contours. As an additional advantage, relatively little data was used in the techniques and models described in this paper.


Conflict of interest statement

The authors declare no competing interests.

Figures

Figure 1
Figure 1
(A) Current treatment planning workflow. (B) Proposed workflow with AI-based dose prediction. Less iterations denoted as dotted-blue lines. TPS = treatment planning system.
Figure 2
Figure 2
Schematic of an example U-net architecture with additional CNN layers used for dose prediction. The numbers above the boxes represent the number of features for each map, while the numbers to the left of each hierarchy in the U-net represents the size of each 2D feature.
Figure 3
Figure 3
Dropout scheme implemented for the U-net and CNN layers.
Figure 4
Figure 4
Schematic for 10-fold cross-validation. A test set is held out from the cross validation procedure, and is used to test the best performance model.
Figure 5
Figure 5
Plot of train vs. validation loss as a function of epochs from one of the folds.
Figure 6
Figure 6
Box plots showing the dose difference statistics for the 8 test patients.
Figure 7
Figure 7
Contours of the planning target volume (PTV) and organs at risk (OAR), true dose wash, predicted dose wash, and difference map of an example patient.
Figure 8
Figure 8
Example of typical dose volume histogram (DVH) comparing true dose and predicted dose for one patient.
Figure 9
Figure 9
Dice similarity coefficients, 2(AB)A+B, comparing isodose volumes between the true dose and predicted dose, ranging from the 0% isodose volume to the 100% isodose volume. The error in the graph represents 1 standard deviation.
Figure 10
Figure 10
Example dose predictions from the U-net model on several patients with vastly different geometries.

References

    1. Brahme A. Optimization of stationary and moving beam radiation therapy techniques. Radiotherapy and Oncology. 1988;12:129–140. doi: 10.1016/0167-8140(88)90167-3. - DOI - PubMed
    1. Bortfeld T, Bürkelbach J, Boesecke R, Schlegel W. Methods of image reconstruction from projections applied to conformation radiotherapy. Physics in Medicine and Biology. 1990;35:1423. doi: 10.1088/0031-9155/35/10/007. - DOI - PubMed
    1. Bortfeld TR, Kahler DL, Waldron TJ, Boyer AL. X-ray field compensation with multileaf collimators. International Journal of Radiation Oncology* Biology* Physics. 1994;28:723–730. doi: 10.1016/0360-3016(94)90200-3. - DOI - PubMed
    1. Webb S. Optimisation of conformal radiotherapy dose distribution by simulated annealing. Physics in Medicine and Biology. 1989;34:1349. doi: 10.1088/0031-9155/34/10/002. - DOI - PubMed
    1. Convery D, Rosenbloom M. The generation of intensity-modulated fields for conformal radiotherapy by dynamic collimation. Physics in Medicine and Biology. 1992;37:1359. doi: 10.1088/0031-9155/37/6/012. - DOI - PubMed

Publication types