. 2019 Jan 31;9(1):1032.
doi: 10.1038/s41598-018-37648-7.

PES1 promotes the occurrence and development of papillary thyroid cancer by upregulating the ERα/ERβ protein ratio

Affiliations

PES1 promotes the occurrence and development of papillary thyroid cancer by upregulating the ERα/ERβ protein ratio

Yi-Bo Qiu et al. Sci Rep. .

Abstract

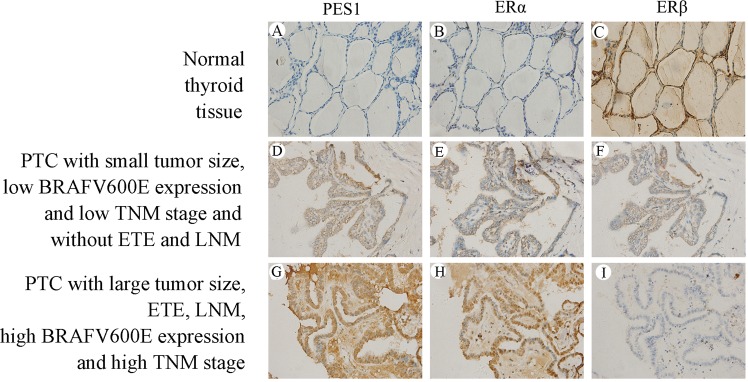
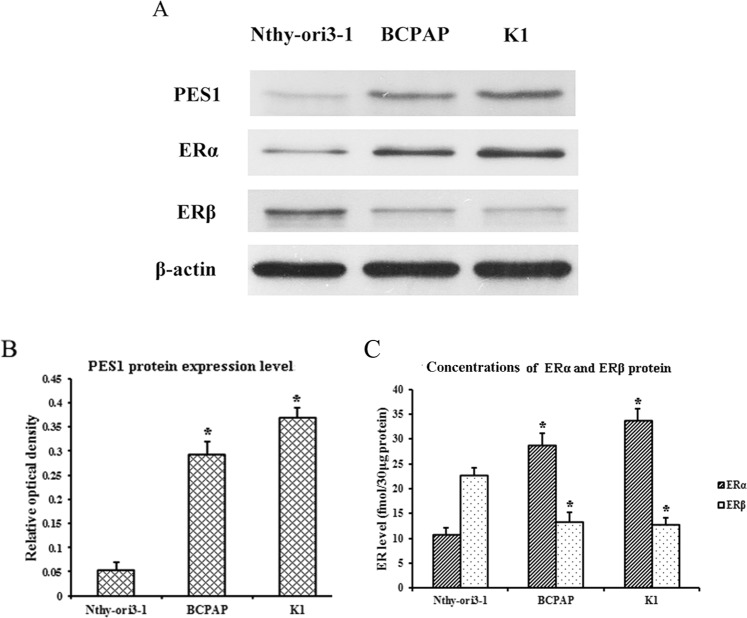
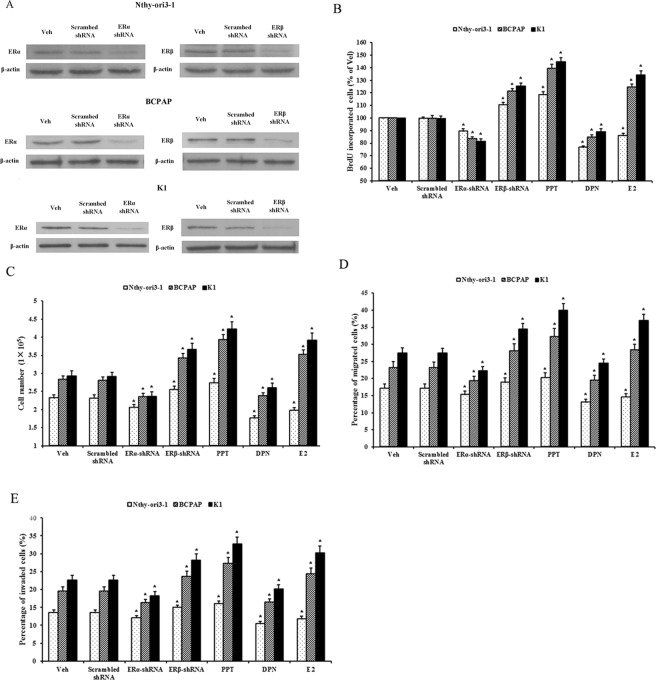
PES1, a BRCT domain-containing protein, has been shown to play a role in modulating the balance and ratio between ERα and ERβ protein, which is involved in the occurrence and development of breast and ovarian cancer. However, its role in connection with the balance and ratio between ERα and ERβ protein in papillary thyroid cancer (PTC) remains unclear. Here, we found that ERα and ERβ were co-expressed in human PTC tissues and cells. ERα promoted and ERβ inhibited the proliferation, invasion and migration of PTC cells. PES1 modulated the balance between ERα and ERβ by elevating the ERα protein level and simultaneously reducing the ERβ protein level, then upregulating the ERα/ERβ protein ratio and promoting the proliferation, invasion and migration of PTC cells. In PTC tissues, PES1 protein level was positively correlated with the ERα protein level and negatively correlated with the ERβ protein level. The PES1 and ERα protein levels were gradually increased and the ERβ protein level was decreased by degree in the occurrence and development of PTC. Increased PES1 and ERα protein levels and decreased ERβ protein level were correlated with the aggressive behaviors of PTC patients such as large tumor size, extrathyroidal extension (ETE), lymph node metastasis (LNM), high BRAFV600E expression and high TNM stage. It is suggested that PES1 promotes the occurrence and development of PTC by elevating the ERα protein level and reducing the ERβ protein level, and then upregulating the ERα/ERβ protein ratio.


Conflict of interest statement

The authors declare no competing interests.

Figures

Figure 1
Figure 1
IHC staining of PES1, ERα and ERβ. The first row (A–C) is the IHC staining of an example of normal thyroid tissues, showing almost no follicular cells with staining for PES1 (A), a few of follicular cells with weak staining for ERα (B) and a lot of follicular cells with strong staining for ERβ (C). The second row (DF) is the IHC staining of an example of PTC tissues with small tumor size, low BRAFV600E expression and TNM stage I and without ETE and LNM, showing quite a few of tumor cells with moderate staining for PES1 (D), ERα (E) and ERβ (F). The third row (GI) is the IHC staining of an example of PTC tissues with large tumor size, ETE, LNM, high BRAFV600E expression and TNM stage IV, showing a lot of tumor cells with strong staining for PES1 (G) and ERα (H), however, a few of tumor cells with weak staining for ERβ (I).
Figure 2
Figure 2
PES1 protein level and ERα/ERβ protein ratio in human PTC-derived BCPAP and K1 cells and normal thyroid-derived Nthy-ori3-1 cells. BCPAP, K1 and Nthy-ori3-1 cells were cultured, then the total protein of these cells was extracted and the protein levels of PES1, ERα and ERβ were assessed by Western blotting. β-actin served as an internal calibrator. (A) Blot examples of PES1, ERα and ERβ protein levels in BCPAP, K1 and Nthy-ori3-1 cells. (B) Bar diagrams of relative PES1 protein level in BCPAP, K1 and Nthy-ori3-1 cells. (C) The concentrations of ERα and ERβ protein in BCPAP, K1 and Nthy-ori3-1 cells. Data presented represent the mean of three independent experiments. Statistical differences between two groups were examined using Students t-test. *P < 0.05, compared with Nthy-ori3-1 normal thyroid cells.
Figure 3
Figure 3
ERα promotes and ERβ inhibits the proliferation, invasion and migration of human PTC cells and normal thyroid cells. BCPAP, K1 and Nthy-ori3-1 cells were stably transfected with the expression vectors of ERα-shRNA, ERβ-shRNA and scrambled shRNA or were exposed to 10 nM of E2, PPT and DPN for 72 h, respectively. (A) Knockdown of ERα and ERβ protein levels by ERα-shRNA and ERβ-shRNA. (B and C) The proliferation of these cells was assessed by BrdU incorporation and cell count assays. (D and F) The migration and invasion of these cells were evaluated by Transwell assay. Data presented represent the mean of three independent experiments. Statistical differences between two groups were examined using Students t-test. *P < 0.05, compared with non treatment (Veh).
Figure 4
Figure 4
Effects of PES1 on the ERα/ERβ protein ratio and the proliferation, invasion and migration of human PTC and normal thyroid cells. The normal thyroid-derived Nthy-ori3-1 cells were stably transfected with the PES1 expression vector or empty vector and the PTC-derived BCPAP and K1 cells were stably transfected with the expression vector of PES1-shRNA or scrambed shRNA. The protein levels of PES1, ERα and ERβ in these stable transfected cells were assessed by Western blotting. β-actin served as an internal calibrator. The proliferation, invasion and migration of these stable transfected cells were assayed after exposure to E2 for 72 h. (A) Blot examples of PES1, ERα and ERβ protein levels in these stable transfected cells. (B) Bar diagrams of relative PES1 protein level in these stable transfected cells. (C) The concentrations of ERα and ERβ protein in these stable transfected cells. (D and E) The proliferation of these stable transfected cells was assessed by BrdU incorporation and cell count assays. (F and G) The migration and invasion of these stable transfected cells were assessed by Transwell assay. Data presented represent the mean of three independent experiments. Statistical differences between two groups were examined using Students t-test. *P < 0.05, compared with non treatment (Veh). #P < 0.05, compared with E2 treatment alone.

Similar articles

Cited by

References

    1. Derwahl M, Nicula D. Estrogen and its role in thyroid cancer. Endocr Relat Cancer. 2014;21:T273–283. doi: 10.1530/ERC-14-0053. - DOI - PubMed
    1. Rahbari R, Zhang L, Kebebew E. Thyroid cancer gender disparity. Future Oncol. 2010;6:1771–1779. doi: 10.2217/fon.10.127. - DOI - PMC - PubMed
    1. Przybylik-Mazurek E, Hubalewska-Dydejczyk A, Fedorowicz A, Pach D. Factors connected with the female sex seem to play an important role in differentiated thyroid cancer. Gynecol Endocrinol. 2012;28:150–155. doi: 10.3109/09513590.2011.563909. - DOI - PubMed
    1. Schonfeld SJ, et al. Hormonal and reproductive factors and risk of postmenopausal thyroid cancer in the NIH-AARP Diet and Health Study. Cancer Epidemiol. 2011;35:e85–90. doi: 10.1016/j.canep.2011.05.009. - DOI - PMC - PubMed
    1. Sungwalee W, Vatanasapt P, Kamsa-Ard S, Suwanrungruang K, Promthet S. Reproductive risk factors for thyroid cancer: a prospective cohort study in Khon Kaen, Thailand. Asian Pac J Cancer Prev. 2013;14:5153–5155. doi: 10.7314/APJCP.2013.14.9.5153. - DOI - PubMed

Publication types

MeSH terms