. 2019 Jan 28;7(1):e00454.
doi: 10.1002/prp2.454. eCollection 2019 Feb.

pH as a potential therapeutic target to improve temozolomide antitumor efficacy : A mechanistic modeling study

Affiliations

pH as a potential therapeutic target to improve temozolomide antitumor efficacy : A mechanistic modeling study

Angélique Stéphanou et al. Pharmacol Res Perspect. .

Abstract

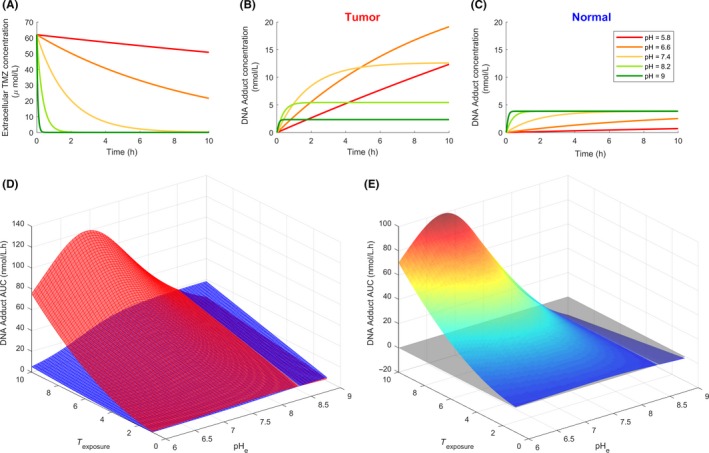
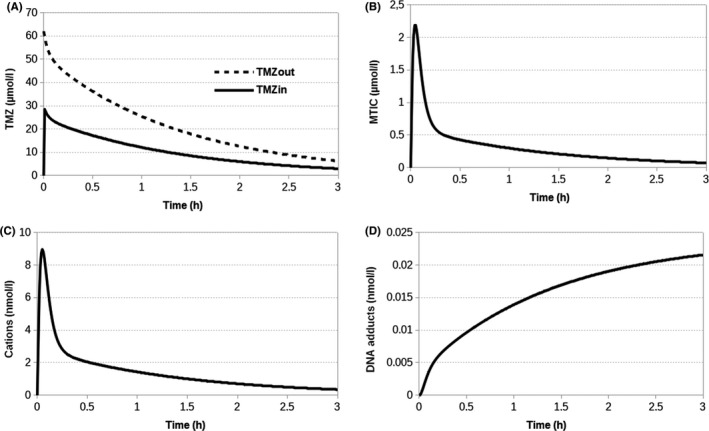
Despite intensive treatments including temozolomide (TMZ) administration, glioblastoma patient prognosis remains dismal and innovative therapeutic strategies are urgently needed. A systems pharmacology approach was undertaken to investigate TMZ pharmacokinetics-pharmacodynamics (PK-PD) incorporating the effect of local pH, tumor spatial configuration and micro-environment. A hybrid mathematical framework was designed coupling ordinary differential equations describing the intracellular reactions, with a spatial cellular automaton to individualize the cells. A differential drug impact on tumor and healthy cells at constant extracellular pH was computationally demonstrated as TMZ-induced DNA damage was larger in tumor cells as compared to normal cells due to less acidic intracellular pH in cancer cells. Optimality of TMZ efficacy defined as maximum difference between damage in tumor and healthy cells was reached for extracellular pH between 6.8 and 7.5. Next, TMZ PK-PD in a solid tumor was demonstrated to highly depend on its spatial configuration as spread cancer cells or fragmented tumors presented higher TMZ-induced damage as compared to compact tumor spheroid. Simulations highlighted that smaller tumors were less acidic than bigger ones allowing for faster TMZ activation and their closer distance to blood capillaries allowed for better drug penetration. For model parameters corresponding to U87 glioma cells, inter-cell variability in TMZ uptake play no role regarding the mean drug-induced damage in the whole cell population whereas this quantity was increased by inter-cell variability in TMZ efflux which was thus a disadvantage in terms of drug resistance. Overall, this study revealed pH as a new potential target to significantly improve TMZ antitumor efficacy.

Keywords: glioblastoma; mathematical modeling; pH; pharmacokinetics‐pharmacodynamics; temozolomide.


Figures

Figure 1
Figure 1
TMZ PK as considered in the original ODE‐based model. It differentiates the extra and intracellular TMZ transformation. In the integration with the cellular automaton, the elements in the dotted box are not described since they play no part in the generation of DNA adducts, the output variable of interest
Figure 2
Figure 2
Models representations. (A) Standard two‐compartment model where the volume of the intracellular compartment is the total volume of all cells; (B) CA model where each cell is explicitly represented and its PK is individually calculated. A hybrid PDE describes the extracellular TMZ concentration in space resulting from TMZ diffusion and local exchange with cells; (C) PK model reduced to the intracellular compartment, as used in (A) and (B)
Figure 3
Figure 3
Relationship between pHe and pHi for normal and tumor cells. The g(x) function corresponds to normal cells and is derived from the physiological status point (sandglass point). We consider that pHi=pHe0.4 as indicated by the function.39 Since normal cells are not able to survive acidity, the function g(x) is only valid from pHe=7 under this value we consider that the intracellular acidity is lethal to the cell. The f(x) function is a linear regression estimated from the points corresponding to different tumor cell types: SCK cells (bullets),34 CC139 cells (squares),33 PANC‐1 cells (triangles),32 other tumor cells (diamonds). The dotted line indicates where pHe = pHi
Figure 4
Figure 4
pH‐dependent TMZ PKPD in tumor and normal cultured cells. (A) Extracellular TMZ concentration time profiles for various extracellular pH values; (B) Intracellular concentration of DNA adducts in tumor cells for various extracellular pH values; (C) Intracellular concentration of DNA adducts in normal cells for various extracellular pH values; (D) DNA adduct AUC values for various extracellular pH values and TMZ exposure duration in tumor (upper curve) or normal (lower curve) cells; (E) Difference in DNA adduct AUC values between tumor and normal cells
Figure 5
Figure 5
The two considered sources of heterogeneity in the medium. (A) pH spatial variations (the dotted line represents the tumor boundary); (B) temporal evolution of TMZ concentration for a homogeneous capillary network and for a degraded one. In the homogeneous case, TMZ is initially (t = 0 h) homogeneously distributed whereas when the capillary network is degraded inside the tumor mass, the tumor does not have access to TMZ initially. Comparison of TMZ PK depending on the cell location in the tumor spheroid, for the homogeneous capillary network (left column) and for the degraded one (right column). The PK is represented for three cells located at three different distance x from the center of the 2D tumor: x=0 (centre), x=25 (intermediate), x=48 (periphery) (tumor radius R=50 grid units) as shown in (A)
Figure 6
Figure 6
Comparison of different tumor conformations. (A) tumor cells in the three different conformation cases: (1) spheroid, (2) cells clusters, (3) spread cells; corresponding oxygen concentration map; corresponding extracellular pH. (B) TMZ degradation/uptake (first columns) and associated DNA‐adducts accumulation in tumor cells (second columns) for the three tumor conformations. (C) mean amount of DNA adducts accumulation per cell for the three different tumor configurations. Note: the mean amount of DNA adducts is calculated over the all tumor cell population for each case
Figure 7
Figure 7
Effect of TMZ transport parameters variability in cells. (A) TMZ intracellular concentration at steady state with respect to TMZ uptake parameter (pT) or efflux parameter (pT2); (B) TMZ cumulative steady state intracellular concentration in a homogeneous cell population (no noise) or a heterogeneous population presenting inter‐cell variability in TMZ uptake (pT ± 80%); (C) TMZ cumulative steady state intracellular concentration in a homogeneous cell population (no noise) or a heterogeneous population presenting inter‐cell variability in TMZ efflux (pT2 ± 80%); (D) TMZ cumulative steady state intracellular concentration with respect to pT and pT2 in a homogeneous cell population (dark curve) or a heterogeneous population presenting inter‐cell variability in TMZ uptake (light curve); (E) TMZ cumulative steady‐state intracellular concentration with respect to pT and pT2 in a homogeneous cell population (dark curve) or a heterogeneous population presenting inter‐cell variability in TMZ efflux (light curve);(F) DNA adducts accumulation in the perturbed and non‐perturbed cases; (G) mean amount of DNA adducts accumulation per cells for perturbed inflow (pT) and outflow (pT2) parameters; (H) close up of (G) with standard deviation (SD) bars removed. Note: the mean amount of DNA adducts is calculated over the all tumor cell population for each case
Figure B1
Figure B1
Agreement of the hybrid model with the initial ODE‐based model. (A) TMZ and (B,C,D) intracellular MTIC, Cation and DNA adducts PK, respectively, for any tumor cell of the cellular automaton. These kinetics reproduce the results presented in Ballesta et al.,4
Figure C1
Figure C1
Relationship between oxygen and pH. (A) The stationary state of oxygen concentration is first calculated for a spheroid of a given radius (R=50 units). The tumor boundary is materialized by the dotted circle line. (B) The stationary oxygen profile along a line passing through the middle of the spheroid is given by the U‐shape curve. The minimum for the oxygen concentration (in arbitrary units) is reached at the center of the tumor (which corresponds to i=100 units). Since H+ production by the cells is limited it is here assumed to saturate beyond a threshold level of oxygen (Oxythr) indicated by the lower dashed line. The upper level of oxygen (Oxymax) correspond to the normal physiological level of oxygen in the tissue. The oxygen variation between these 2 levels (ΔOxy) is assumed to correspond to the maximum pH variation between the center of the tumor and the surrounding tissue (ΔpH)

Similar articles

Cited by

References

    1. Stupp R, Mason WP, van den Bent MJ, et al. Radiotherapy plus concomitant and adjuvant temozolomide for glioblastoma. N Engl J Med. 2005;352:987‐996. - PubMed
    1. Niewald M, Berdel C, Fleckenstein J, Licht N, Ketter R, Rube C. Toxicity after radiochemotherapy for glioblastoma using temozolomide–a retrospective evaluation. Radiat Oncol. 2011;6:141. - PMC - PubMed
    1. Syro LV, Rotondo F, Camargo M, Ortiz LD, Serna CA, Kovacs K. Temozolomide and Pituitary tumours: current Understanding, Unresolved Issues, and Future Directions. Front Endocrinol (Lausanne). 2018;15(9):318. - PMC - PubMed
    1. Ballesta A, Zhou Q, Zhang X, LV H, Gallo JM. Multiscale design of cell‐type‐specific pharmacokinetic/pharmacodynamic models for personalized medicine: application to temozolomide in brain tumours. CPT Pharmacometrics Syst Pharmacol 2014;3:e112. - PMC - PubMed
    1. Thomas A, Tanaka M, Trepel J, Reinhold WC, Rajapakse VN, Pommier Y. Temozolomide in the Era of Precision Medicine. Cancer Res. 2017;77(4):823‐826. - PMC - PubMed

Publication types

MeSH terms

Substances