. 2019 Apr;18(2):e12901.
doi: 10.1111/acel.12901. Epub 2019 Jan 31.

Extranuclear DNA accumulates in aged cells and contributes to senescence and inflammation

Affiliations

Extranuclear DNA accumulates in aged cells and contributes to senescence and inflammation

Yuk Yuen Lan et al. Aging Cell. 2019 Apr.

Abstract

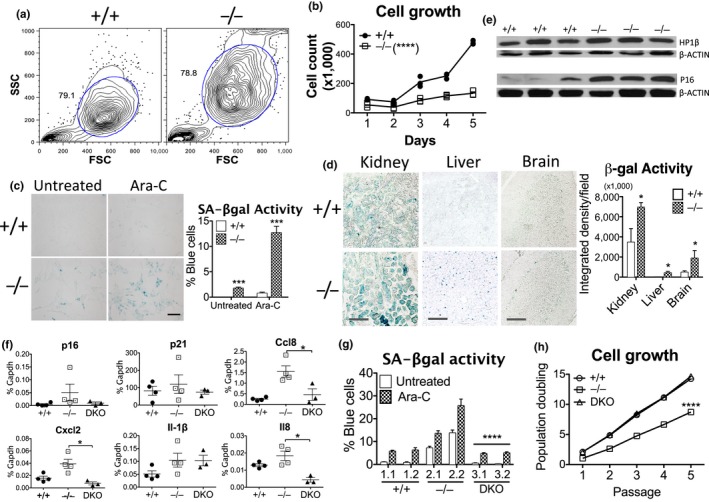
Systemic inflammation is central to aging-related conditions. However, the intrinsic factors that induce inflammation are not well understood. We previously identified a cell-autonomous pathway through which damaged nuclear DNA is trafficked to the cytosol where it activates innate cytosolic DNA sensors that trigger inflammation. These results led us to hypothesize that DNA released after cumulative damage contributes to persistent inflammation in aging cells through a similar mechanism. Consistent with this notion, we found that older cells harbored higher levels of extranuclear DNA compared to younger cells. Extranuclear DNA was exported by a leptomycin B-sensitive process, degraded through the autophagosome-lysosomal pathway and triggered innate immune responses through the DNA-sensing cGAS-STING pathway. Patient cells from the aging diseases ataxia and progeria also displayed extranuclear DNA accumulation, increased pIRF3 and pTBK1, and STING-dependent p16 expression. Removing extranuclear DNA in old cells using DNASE2A reduced innate immune responses and senescence-associated (SA) β-gal enzyme activity. Cells and tissues of Dnase2a-/- mice with defective DNA degradation exhibited slower growth, higher activity of β-gal, or increased expression of HP-1β and p16 proteins, while Dnase2a-/- ;Sting-/- cells and tissues were rescued from these phenotypes, supporting a role for extranuclear DNA in senescence. We hypothesize a direct role for excess DNA in aging-related inflammation and in replicative senescence, and propose DNA degradation as a therapeutic approach to remove intrinsic DNA and revert inflammation associated with aging.

Keywords: Dnase2a; STING pathway; cellular senescence; extranuclear DNA; inflammation; premature aging.


Conflict of interest statement

The authors declare no conflict of interest.

Figures

Figure 1
Figure 1
Old cells accumulate nuclear DNA in the cytosol. (a) IF staining of anti‐dsDNA (red) in young and old WI38 cells. Insets, enlarged cells; scale bar, 50 μm. Quantitation shows manual cell count with extranuclear DNA in percentage (middle panel) and signal intensity per cell in nucleus and cytosol (right panel). (b) TUNEL assay (green) detecting DNA fragmentation in young and old MRC5 cells without or with Ara‐C treatment. Scale bar, 50 μm. (c) IF staining and quantitation of anti‐dsDNA (green) in young and old MRC5 cells untreated or treated with Ara‐C. Scale bar, 20 μm. (d) IF staining and quantitation of anti‐dsDNA (green) in young and old MRC5 cells untreated or treated with leptomycin B (LMB, 20 nM, 24 hr). Insets show enlarged cells. Scale bar, 50 μm. (e) Dual staining of dsDNA (green) and NUP98 (red) in old MRC5 cells. Dotted squares highlight DNA patterns indicated; scale bar, 20 μm. Results are representative of 3 (a) or 2 (b, c, d, e) independent experiments. Ara‐C treatment, 10 μM, 24 hr. DAPI (blue) used as counterstain in b–e. Quantitation is based on 5 random fields at 10× or 20× in representative experiment. Values in quantitation are mean ± SEM. p‐value of significance by t test, *p < 0.05, **p < 0.01, ***p < 0.005, ****p < 0.0001
Figure 2
Figure 2
Innate immune activation in old cells. (a) Expression of IFNI‐inducible and inflammatory genes in young and old WI38 cells by RT‐qPCR, UT, untreated, Ara‐C treated, 10 μM, 24 hr. (b) Heat map showing significantly upregulated (top) or downregulated (bottom) genes in old versus young MRC5 cells by NanoString in three biological replicates (full gene list in Figure S2A). (c) Heat map showing DEGs in old cells that overlap with IFNI‐regulated genes restricted to fibroblasts (35 upregulated on top and 31 downregulated genes on bottom, full list in Figure S2B). Numbers after each cell line indicate PD numbers. (d) Enriched GSEA‐ranked gene sets in old compared with young cells across IMR90, MRC5, and WI38 cell lines based on RNA‐seq data. Enrichment in old cells is at low end of ranking, FDR for significance. (e) Unsupervised clustering of young and old cells based on STING‐related genes (full list in Figure S2G). (f) Gene expression of MX1, CXCL10, and IL‐6 in young and old MRC5 cells by RT‐qPCR, untreated or treated with bafilomycin A (BAF, 20 nM) or rapamycin (RAPA, 1 nM) for 8 hr, significance relative to untreated cells. (g) Transcript expression of MX1 and IFIT1 in young and old MRC5 cells measured by RT‐qPCR after knocking down cGAS, STING, or TBK1 by transfected siRNAs, significance relative to siNEG, nontargeting control. Results in a, f, and g are representative of 2 independent experiments, p‐values of significance by t test
Figure 3
Figure 3
DNA accumulation and sensing in aging diseases. (a) IF staining and quantitation of anti‐dsDNA in healthy (H), ataxia (AT), and progeria (PS) skin fibroblasts. Numbers represent different fibroblasts of each genotype (Coriell catalog no. listed in Experimental Procedures). One‐way ANOVA among samples, **p = 0.0038, and significance of grouped genotype by t test as indicated. (b) Enriched hallmark gene sets in AT (top) and PS (bottom) by GSEA with FDR < 0.25. (c) TNF‐α, MX1 and IL‐6 transcript expression of H, AT, and PS fibroblasts assessed by RT‐qPCR, ****p < 0.0001 among samples by 1‐way ANOVA for all 3 genes. Asterisks indicate significance of individual cells versus H1 for TNF‐α, H4 and H5 for MX1, and all healthy cells for IL‐6 by Tukey's test. (d) Immunoblot showing DNA‐sensing mediators in H, AT, and PS cells, double bands in total STING are visible in some AT cells, β‐ACTIN, loading control. (e) IF staining and quantitation of pIRF3 and pTBK1 (both red signals) in H, AT, and PS cells, DAPI (blue), counterstain. Significance among samples for both phospho‐proteins, ****p < 0.0001, 1‐way ANOVA; and individual cells versus H1 and H4 by Tukey's test as indicated. (f–g) H, AT, and PS cells with STING knocked down by transfected siRNAs and assessed for MX1 and IL‐6 expressions by RT‐qPCR (f), and p16 expression (red) by IF staining (g). Two‐way ANOVA by genotype and siSTING in (g), ****p < 0.0001; DAPI (blue), counterstain. Asterisks denote significance of siSTING versus siNEG control in individual cells by t test. Results in a, c, d, e, f, and g are representative of 2 independent experiments
Figure 4
Figure 4
DNA burden impacts age‐related inflammation. (a) Digestion of 50 μg calf thymus DNA by cell lysates (μl) from 2 million young or old MRC5 cells. Degraded DNA fragments visualized on 0.7% agarose gel by ethidium bromide. Recombinant DNASE2 (10 μg/ml) used as positive control. L, DNA ladder; red denotes saturated amounts of DNA. (b) MX1 and CXCL10 mRNA expression assessed by RT‐qPCR in young and old MRC5 cells after knocking down DNASE2A using transfected siRNAs; t test significance relative to siNEG, nontargeting control. (c–e) Young and old MRC5 cells transduced with DNASE2A ORF for constitutive overexpression, and examined for anti‐dsDNA staining by IF (c), SA‐β‐gal activity (d), and expression of inflammatory and cell‐cycle genes by RT‐qPCR (e). EGFP, negative control; scale bar, 20 μm in (c) and 50 μm in (d). Significance based on eGFP values by t test. All data are representative of at least 2 independent experiments
Figure 5
Figure 5
Dnase2a deficiency recapitulates cellular senescence. (a) Contour plots showing FSC (forward scatter) for cell size and SSC (side scatter) for granularity in Dnase2a +/+ and Dnase2a / MLFs. (b) Cell proliferation of Dnase2a +/+ and Dnase2a / MLFs by manual count with trypan blue, ****p < 0.0001 by phenotype, 2‐way ANOVA. (c) SA‐β‐gal activity and quantitation of Dnase2a +/+ and Dnase2a / MLFs without or with Ara‐C treatment (10 μM, 24 hr); scale bar, 50 μm. (d) Representative SA‐β‐gal staining of Dnase2a +/+ and Dnase2a / mouse tissues as indicated. Quantitation based on 5 random fields of 5× or 10× images of representative pair of mice, scale bar, 100 μm in kidney and liver, 200 μm in brain. (e) Immunoblot of HP1β and p16 in Dnase2a +/+ and Dnase2a / kidney tissues, β‐ACTIN, loading control. (f) Transcript expression of cell‐cycle genes and SASP factors in kidney tissues of Dnase2a +/+ (n = 4), Dnase2a / (n = 4), and Dnase2a;Sting double KO (DKO) (n = 3) mice by RT‐qPCR. (g) Quantitation of SA‐β‐gal activity in Dnase2a +/+, Dnase2a / , and DKO MLFs, untreated or treated with Ara‐C (10 μM, 24 hr). Numbers indicate single clones of each genotype. ****p < 0.0001, for genotype and Ara‐C‐treatment by 2‐way ANOVA, and t test between Dnase2a / and DKO MLFs as indicated. (h) Cell growth over serial passage in Dnase2a +/+, Dnase2a / , and DKO MLFs where equal number of cells are re‐plated at each split. Effect by genotype between Dnase2a / and DKO, ****p < 0.0001, 2‐way ANOVA. Data are representative of 2 independent experiments in a–c, g, h, and 3 pairs of age and sex‐matched littermates in d, e. p‐value of significance by t test or as indicated

References

    1. Almine, J. F. , O'Hare, C. A. , Dunphy, G. , Haga, I. R. , Naik, R. J. , Atrih, A. , … Unterholzner, L. (2017). IFI16 and cGAS cooperate in the activation of STING during DNA sensing in human keratinocytes. Nature Communications, 8, 14392 10.1038/ncomms14392. - DOI - PMC - PubMed
    1. Bartkova, J. , Rezaei, N. , Liontos, M. , Karakaidos, P. , Kletsas, D. , Issaeva, N. , … Gorgoulis, V. G. (2006). Oncogene‐induced senescence is part of the tumorigenesis barrier imposed by DNA damage checkpoints. Nature, 444(7119), 633–637. 10.1038/nature05268. - DOI - PubMed
    1. Baruch, K. , Deczkowska, A. , David, E. , Castellano, J. M. , Miller, O. , Kertser, A. , … Schwartz, M. (2014). Aging‐induced type I interferon response at the choroid plexus negatively affects brain function. Science, 346(6205), 89–93. 10.1126/science.1252945. - DOI - PMC - PubMed
    1. Coppé, J. P. , Patil, C. K. , Rodier, F. , Krtolica, A. , Beausejour, C. M. , Parrinello, S. , … Campisi, J. (2010). A human‐like senescence‐associated secretory phenotype is conserved in mouse cells dependent on physiological oxygen. PLoS One, 5(2), e9188 10.1371/journal.pone.0009188. - DOI - PMC - PubMed
    1. De Vos, W. H. , Houben, F. , Kamps, M. , Malhas, A. , Verheyen, F. , Cox, J. , … Broers, J. L. (2011). Repetitive disruptions of the nuclear envelope invoke temporary loss of cellular compartmentalization in laminopathies. Human Molecular Genetics, 20(21), 4175–4186. 10.1093/hmg/ddr344. - DOI - PubMed

Publication types