. 2019 Apr;18(2):e12902.
doi: 10.1111/acel.12902. Epub 2019 Feb 1.

Activation of MT2 receptor ameliorates dendritic abnormalities in Alzheimer's disease via C/EBPα/miR-125b pathway

Affiliations

Activation of MT2 receptor ameliorates dendritic abnormalities in Alzheimer's disease via C/EBPα/miR-125b pathway

Hui Tang et al. Aging Cell. 2019 Apr.

Abstract

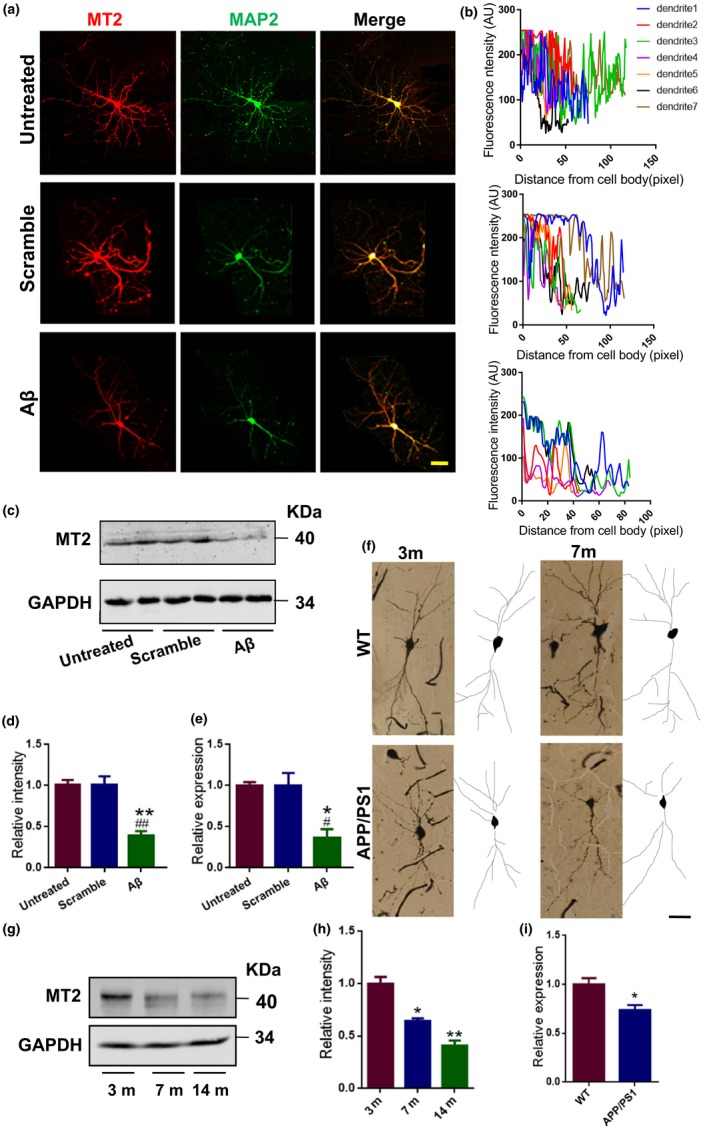
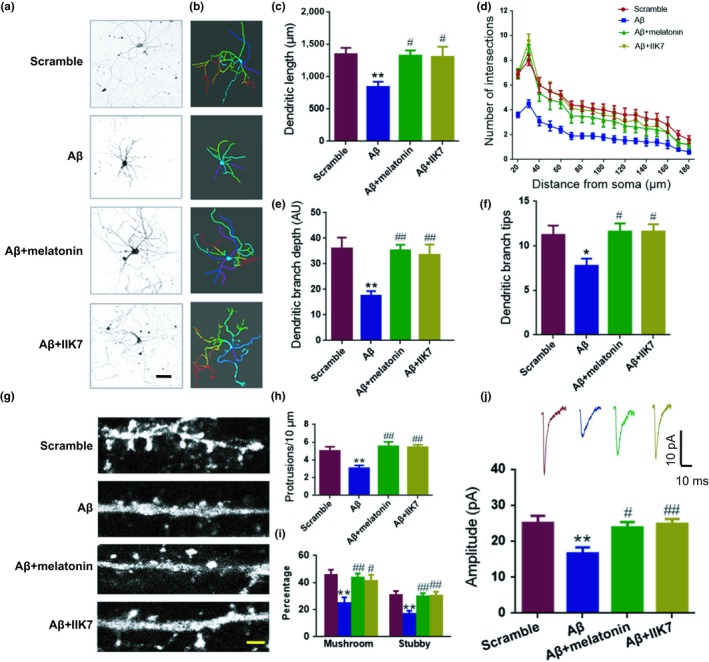
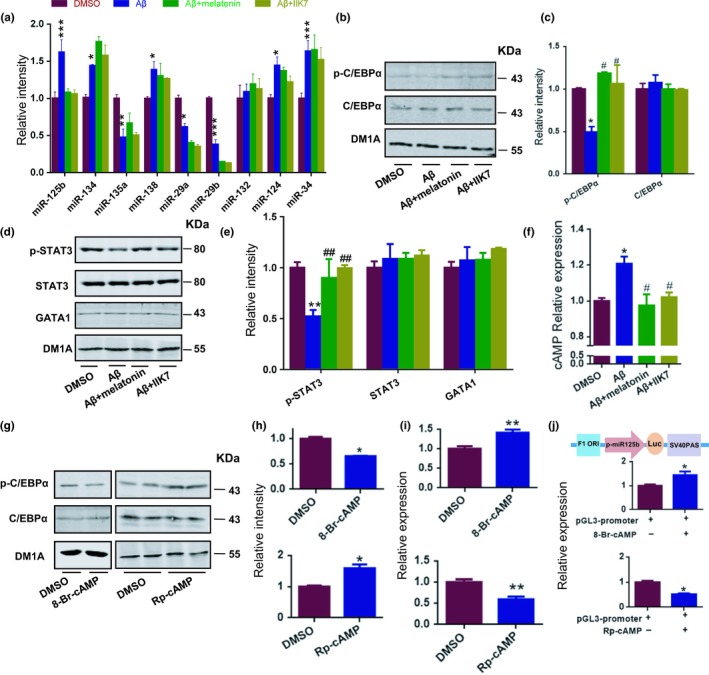
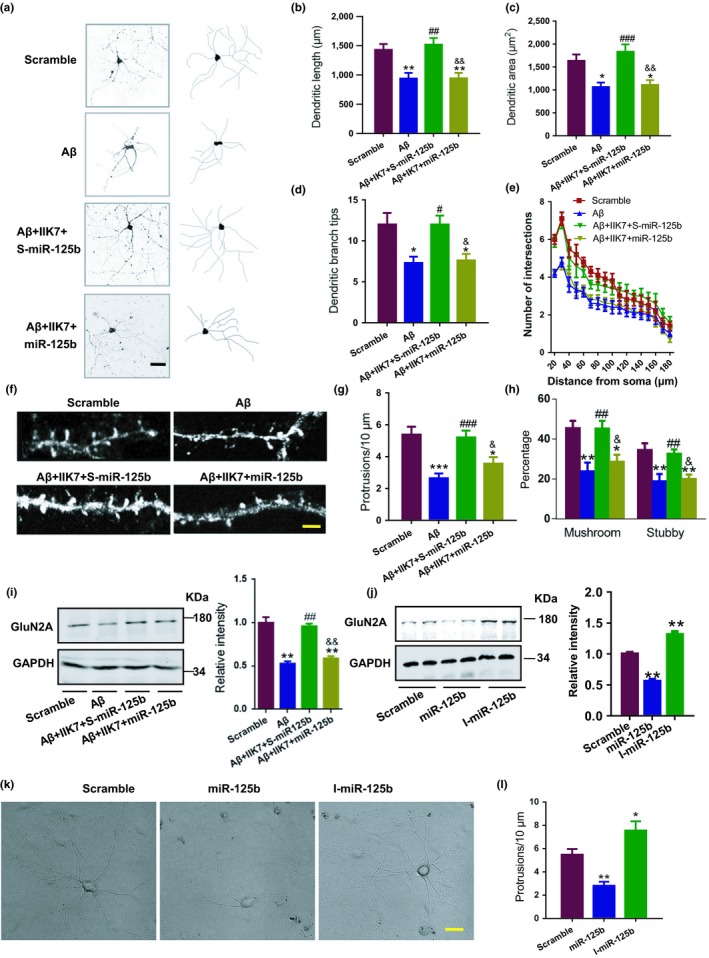
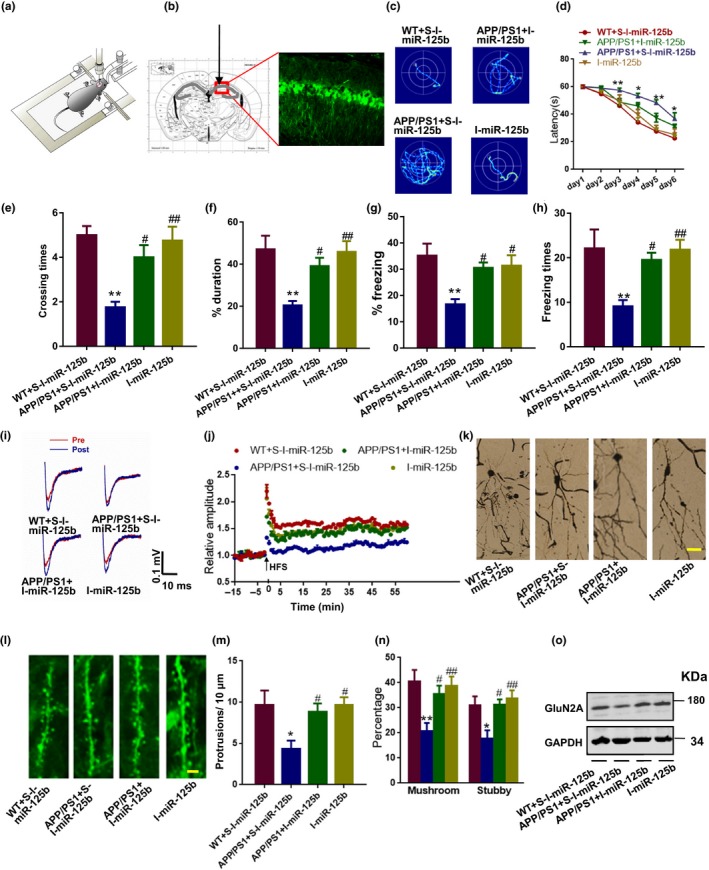
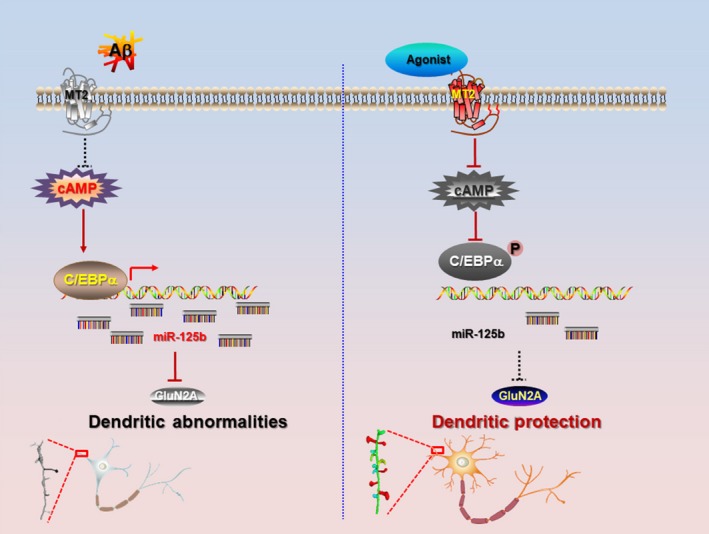
Impairments of dendritic trees and spines have been found in many neurodegenerative diseases, including Alzheimer's disease (AD), in which the deficits of melatonin signal pathway were reported. Melatonin receptor 2 (MT2) is widely expressed in the hippocampus and mediates the biological functions of melatonin. It is known that melatonin application is protective to dendritic abnormalities in AD. However, whether MT2 is involved in the neuroprotection and the underlying mechanisms are not clear. Here, we first found that MT2 is dramatically reduced in the dendritic compartment upon the insult of oligomer Aβ. MT2 activation prevented the Aβ-induced disruption of dendritic complexity and spine. Importantly, activation of MT2 decreased cAMP, which in turn inactivated transcriptional factor CCAAT/enhancer-binding protein α(C/EBPα) to suppress miR-125b expression and elevate the expression of its target, GluN2A. In addition, miR-125b mimics fully blocked the protective effects of MT2 activation on dendritic trees and spines. Finally, injection of a lentivirus containing a miR-125b sponge into the hippocampus of APP/PS1 mice effectively rescued the dendritic abnormalities and learning/memory impairments. Our data demonstrated that the cAMP-C/EBPα/miR-125b/GluN2A signaling pathway is important to the neuroprotective effects of MT2 activation in Aβ-induced dendritic injuries and learning/memory disorders, providing a novel therapeutic target for the treatment of AD synaptopathy.

Keywords: Alzheimer’s disease; MT2; dendritic complexity; dendritic spines; melatonin; miRNA.


Conflict of interest statement

The authors declare no competing financial interests.

Figures

Figure 1
Figure 1
MT2 expression is reduced in AD model both in vivo and in vitro. (a–e) Mouse primary hippocampal neurons treated with 1 μM oligomeric Aβ and its scrambled peptide at DIV 7 for 2 days. The neurons (DIV 9) treated or left untreated were fixed with 4% PFA and costained with anti‐MT2 (red) and anti‐MAP2 (green) antibodies. Representative confocal images are shown (a). Scale bar = 40 μm. MT2 immunofluorescence intensity in different neuronal dendrites when neurons were treated with (b, lowest panel), without Aβ42 (b, middle panel), or left untreated (b, top panel). AU means arbitrary unit. Cell lysates from neurons treated with Aβ, the scrambled, or left untreated were evaluated by Western blot with an anti‐MT2 antibody (c), and the MT2 expression level was quantified (d). Total RNA was extracted, followed by reverse transcription as described previously. Relative MT2 mRNA expression from the above cDNA was quantified by real‐time PCR (e). *p < 0.05, **p < 0.01 (vs. Untreated); # p < 0.05, ## p < 0.01 (vs. Scramble), one‐way ANOVA, Tukey's multiple comparisons test). N = 4–5. All the experiments were repeated by at least three times. Data are presented as the mean ± SEM. (f) Golgi staining was performed on APP/PS1 mice and their WT littermates to evaluate the dendritic morphology at 3 and 7 months of age. Representative Golgi staining image (left) and reconstructions (right) are shown. Scale bar = 40 μm. N = 4–5 mice per group. (g–h) Hippocampal homogenates were prepared from 3‐, 7‐, and 14‐month‐old APP/PS1‐AD mice (Tg); then, the MT2 protein level was examined by Western blot. Representative images (g) and the quantitative analysis (h) are presented. *p < 0.05, **p < 0.01 (vs. 3 m); one‐way ANOVA, Tukey's multiple comparisons test; N = 4–5 mice per group. All the experiments were repeated by at least three times. (i) Relative expression level of MT2 mRNA in 7‐month‐old APP/PS1 and WT mouse hippocampus homogenates by qPCR assay. *p < 0.05 (vs. WT); Student's t test; N = 4–5 mice per group
Figure 2
Figure 2
Activation of the MT2 receptor rescues the Aβ42‐induced dendritic impairment. (a–f) Mouse primary hippocampal neurons at DIV 7 were treated with Aβ, Aβ + melatonin, Aβ + IIK7, or the scrambled peptide for 48 hr. Representative images after treatment (a) and 3D reconstructions of neurons in panel (a) are shown in (b), color‐coded is according to their branch depth. Warmer hues indicate higher branch depth or tip orders. AU means arbitrary unit. Scale bar = 40 μm. (c–f) Quantitative analyses of dendritic length (μm) (c), Sholl analysis (d), dendritic branch depth (e), and dendritic branch tips (f) were conducted by Imaris software. *p < 0.05, **p < 0.01 (vs. Scramble; one‐way ANOVA, Tukey's multiple comparisons test). # p < 0.05, ## p < 0.01 (vs. Aβ; one‐way ANOVA, Tukey's multiple comparisons test). N = 13–15. Data are presented as the mean ± SEM. (g–j) Mouse primary hippocampal neurons treated with Aβ42, Aβ42 + melatonin, Aβ42 + IIK7, or the control scrambled Aβ42 peptide at DIV 19 were cultured to DIV 21. (g) Representative confocal micrographs are shown. The spines were visualized using GFP‐expressing lentivirus. Scale bar=3 μm. Then, spine density (protrusions/10 μm) (h) and percentage of mushroom and stubby‐like spines (i) were analyzed. N = 13–15. (j) Whole‐cell patch clamp recording was performed as described in the “Materials and Methods” section. Representative mEPSC curve (upper panel) and quantitative analysis of amplitude (pA) (lower panel) are presented. **p < 0.01 (vs. Scramble; one‐way ANOVA, Tukey's multiple comparisons test). # p < 0.05, ## p < 0.01 (vs. Aβ; one‐way ANOVA, Tukey's multiple comparisons test). N = 8–10 slice from 4 to 5 mice for each group. Data are presented as the mean ± SEM
Figure 3
Figure 3
The neuroprotective effect of MT2 activation is mediated by cAMP‐C/EBPα‐miR‐125b signaling. (a–f) Mouse primary hippocampal neurons at DIV 7 were treated with Aβ, Aβ + melatonin, Aβ + IIK7, or the scrambled peptide for 2 days. (a) Total RNA was extracted from mouse primary hippocampal neurons at DIV 9 and reverse transcribed by using a miRcute miRNA first‐strand cDNA Synthesis Kit (Tiangen, Inc.). The levels of miR‐125b, miR‐134, miR‐135a, miR‐138, miR‐29a/b, miR‐132, miR‐124, and miR‐34 were quantified by qPCR. N = 4–5. (b–g) The nuclear extracts from the neurons above were evaluated by Western blot with the anti‐pSer21‐C/EBPα antibody (p‐C/EBPα), anti‐C/EBPα antibody (b), anti‐pY705‐STAT3 antibody (pY705‐STAT3), anti‐STAT3 antibody, and anti‐GATA1 antibody (d). Quantitative analyses of panel (b) and panel (d) are shown in panel (c) and panel (e), respectively. N = 4–5. (f) cAMP production level in the neurons above was quantified with an ELISA kit. *p < 0.05, **p < 0.01, ***p < 0.001 (vs. DMSO; one‐way ANOVA, Tukey's multiple comparisons test). # p < 0.05, ## p < 0.01 (vs. Aβ; one‐way ANOVA, Tukey's multiple comparisons test). N = 4–5. All the experiments were repeated by at least three times. Data are presented as the mean ± SEM. (g–i) Mouse primary hippocampal neurons at DIV 7 were treated with 8‐Br‐cAMP as well as Rp‐cAMP. One hour later, nuclear lysates were prepared and quantified via Western blot assay with the anti‐pSer21‐C/EBPα antibody (p‐C/EBPα) and anti‐C/EBPα antibody (g). Quantitative analyses are shown in panel (h). (i) Relative expression of miR‐125b after 8‐Br‐cAMP and Rp‐cAMP treatment. *p < 0.05, **p < 0.01 (vs. DMSO; Student's t test). N = 4–5. All the experiments were repeated by at least three times. Data are presented as the mean ± SEM. (j) The promoter region of miR‐125b was cloned into the pGL3 vector (pGL3‐miR‐125b). The HEK293 cells were transfected with pGL3‐miR‐125b. Forty‐seven hours later, the cells were treated with 8‐Br‐cAMP and Rp‐cAMP for 1 hr. Then, cell lysates were collected and analyzed with firefly luciferase assay. Upper panel is the diagram of pGL3‐miR‐125b plasmid. p‐miR‐125b, promoter region of miR‐125b; SV40 PAS, SV40 poly A signal. *p < 0.05 (vs. control; Student's t test). N = 4–6. All the experiments were repeated by at least three times. Data are presented as the mean ± SEM
Figure 4
Figure 4
MiR‐125b suppression is involved in the protective effects of MT2 on dendritic impairments. (a–e) Mouse primary hippocampal neurons at DIV 7 were treated with scrambled peptide (Scramble), Aβ, Aβ plus IIK7 plus the scrambled control for miR‐125b (Aβ + IIK7 + S‐miR‐125b) or Aβ plus IIK7 plus miR‐125b mimics (Aβ + IIK7 + miR‐125b) for 2 days. (a) Representative confocal images (a, left) and their reconstructions (a, right) are shown. Scale bar = 40 μm. Quantitative analysis of total dendritic length (μm) (b), dendritic area (μm2) (c), dendritic branch tips (d), and number of intersections (e) are presented. *p < 0.05, **p < 0.01 (vs. Scramble; one‐way ANOVA, Tukey's multiple comparisons test). # p < 0.05, ## p < 0.01, ### p < 0.001 (vs. Aβ; one‐way ANOVA). & p < 0.05, && p < 0.01 (vs. Aβ + IIK7 + S‐miR‐125b; one‐way ANOVA, Tukey's multiple comparisons test). N = 12–15. Data are presented as the mean ± SEM. (f–i) Mouse primary hippocampal neurons at DIV 19 were treated with the scrambled Aβ42 peptide (Scramble), Aβ, Aβ + IIK7 + S‐miR‐125b or Aβ + IIK7 + miR‐125b and cultured to DIV 21. Representative confocal images (f), quantitative analysis of spine density (protrusions/10 μm) (g), and the percentage of mushroom and stubby‐like spines (h) are shown. Scale bar = 2 μm. N = 12–14. (i) Cell lysates were collected from the neurons treated as described in (f), and Western blot was used to evaluate the protein level of GluN2A. N = 4–5. All the experiments were repeated by at least three times. Representative images (left panel) and the quantitative analysis (right panel) are shown. *p < 0.05, **p < 0.01 (vs. scramble; one‐way ANOVA, Tukey's multiple comparisons test). # p < 0.05, ## p < 0.01, ### p < 0.001 (vs. Aβ; one‐way ANOVA, Tukey's multiple comparisons test). & p < 0.05, && p < 0.01 (vs. Aβ + IIK7 + S‐miR‐125b; one‐way ANOVA, Tukey's multiple comparisons test). Data are presented as the mean ± SEM. (j) Cell lysates from DIV 21 primary hippocampal neurons treated with miR‐125b, the inhibitor of miR‐125b (I‐miR‐125b), and the scrambled control (Scramble) were collected. Western blot was used to evaluate the protein level of GluN2A. **p < 0.01 (vs. Scramble; one‐way ANOVA, Tukey's multiple comparisons test). N = 4–5. All the experiments were repeated by at least three times. (k) Representative images of primary hippocampal neurons treated as described in (j) are shown. Scale bar = 20 μm. Quantitative analyses of spine density (protrusions/10 μm) were performed (l). *p < 0.05, **p < 0.01 (vs. Scramble; one‐way ANOVA, Tukey's multiple comparisons test). N = 11–15. Data are presented as the mean ± SEM
Figure 5
Figure 5
Inhibition of miR‐125b rescues the dendritic abnormalities and learning/memory impairments in AD mice. (a–h) The CA1 of 5‐month‐old APP/PS1 mice and WT littermates was injected with I‐miR‐125b or its scrambled control as indicated. Then, 1 month later, the mice were subjected to the Morris water maze and context fear conditioning test to evaluate learning and memory. The diagram for the stereotactic injection experiment is shown in (a), and a representative image of the injection site and virus expression is shown in (b). (c–f) Representative traces (c) and latencies (d) to the platform were recorded during final training day (day 7). F 3, 15 = 8.342. *p < 0.05, **p < 0.01 (vs. WT + S‐I‐miR‐125b mice; two‐way ANOVA, N = 6–8 for each group). Data are presented as the mean ± SEM. On the ninth day of the Morris water maze test, the platform was removed, and the probe test was performed. The crossing times to the platform region (e) and the percentage of duration spent in the target quadrant (f) were analyzed. *p < 0.05, **p < 0.01 (vs. WT + S‐I‐miR‐125b mice); # p < 0.05, ## p < 0.01 (vs. APP/PS1 + S‐I‐miR‐125b mice); one‐way ANOVA, Tukey's multiple comparisons test, N = 6–8 for each group. Data are presented as the mean ± SEM. (g–h) Mice were also subjected to the context fear conditioning test. The freezing response during a retrieval test performed 24 hr after fear training (recent memory) was analyzed. Percentage of time spent freezing (g) and number of freezing bouts (h) were quantified. **p < 0.01 (vs. WT + S‐I‐miR‐125b); # p < 0.05, ## p < 0.01 (vs. APP/PS1 + S‐I‐miR‐125b); one‐way ANOVA, Tukey's multiple comparisons test. N = 6–8 for each group. Data are presented as the mean ± SEM. (i–j) Brain slices at 300 μm thick were collected and used for the MED64 electrophysiological recording. Representative field excitatory postsynaptic potential (fEPSP) traces (red for pre‐high‐frequency stimulation (HFS) and blue for post‐HFS) (left panel) and the quantitative analysis for the 75‐min recording (right panel) (i). Time courses of mean fEPSP slope changes in response to HFS of all activated channels in 6–7 slices from three mice each for WT + S‐I‐miR‐125b, APP/PS1 + S‐I‐miR‐125b, APP/PS1 + I‐miR‐125b, and I‐miR‐125b groups (j). (k–n) Brain slices were collected for dendritic morphology and for the evaluation of dendritic spines. Representative images of dendrites (k) and dendritic spines (l) are shown. Scale bar = 40 μm for (k); Scale bar = 3 μm for (l). Quantitative analyses of the spine density (m) and the percentage of mushroom and stubby‐like spines (n) were performed. *p < 0.05, **p < 0.01 (vs. WT + S‐I‐miR‐125b); # p < 0.05, ## p < 0.01 (vs. APP/PS1 + S‐I‐miR‐125b); one‐way ANOVA, Tukey's multiple comparisons test. N = 8–10 slice from 3 to 4 mice for each group. Data are presented as the mean ± SEM. (o) Hippocampal tissue lysates from the mice above were collected, and Western blot was used to detect the protein level of GluN2A. N = 4–5. All the experiments were repeated by at least three times
Figure 6
Figure 6
A working model for the neuroprotection of MT2 signal. In the AD brain, MT2 is downregulated and induces the upregulation of cyclic adenosine monophosphate (cAMP), which results in the activation of C/EBPα and upregulation of miR‐125b significantly. The increased miR‐125b post‐transcriptionally suppressed the expression of GluN2A and in turn leads to the dendritic abnormalities. Activation of MT2 or inhibition of miR‐125b is able to rescue those aberrant, as well as the learning/memory impairments

References

    1. Alarma‐Estrany, P. , Crooke, A. , Mediero, A. , Pelaez, T. , & Pintor, J. (2008). Sympathetic nervous system modulates the ocular hypotensive action of MT2‐melatonin receptors in normotensive rabbits. Journal of Pineal Research, 45(4), 468–475. 10.1111/j.1600-079X.2008.00618.x - DOI - PubMed
    1. Ballard, C. , Gauthier, S. , Corbett, A. , Brayne, C. , Aarsland, D. , & Jones, E. (2011). Alzheimer's disease. Lancet, 377(9770), 1019–1031. - PubMed
    1. Banzhaf‐Strathmann, J. , Benito, E. , May, S. , Arzberger, T. , Tahirovic, S. , Kretzschmar, H. , … Edbauer, D. (2014). MicroRNA‐125b induces tau hyperphosphorylation and cognitive deficits in Alzheimer's disease. EMBO Journal, 33(15), 1667–1680. 10.15252/embj.201387576 - DOI - PMC - PubMed
    1. Brunner, P. , Sozer‐Topcular, N. , Jockers, R. , Ravid, R. , Angeloni, D. , Fraschini, F. , … Savaskan, E. (2006). Pineal and cortical melatonin receptors MT1 and MT2 are decreased in Alzheimer's disease. European Journal of Histochemistry, 50(4), 311–316. - PubMed
    1. Carpenter, R. L. , & Lo, H. W. (2014). STAT3 Target genes relevant to human cancers. Cancers (Basel), 6(2), 897–925. 10.3390/cancers6020897 - DOI - PMC - PubMed

Publication types

LinkOut - more resources