

doi: 10.1002/cpps.84.
Epub 2019 Feb 1.
Tandem Affinity Purification and Mass Spectrometry (TAP-MS) for the Analysis of Protein Complexes
Affiliations
- PMID: 30706993
- PMCID: PMC6579647
- DOI: 10.1002/cpps.84
Item in Clipboard
Tandem Affinity Purification and Mass Spectrometry (TAP-MS) for the Analysis of Protein Complexes
Curr Protoc Protein Sci.
2019 Jun.
Abstract
Affinity purification followed by mass spectrometry has become the technique of choice to identify binding partners in biochemical complexes isolated from a physiologic cellular context. In this report we detail our protocol for tandem affinity purification (TAP) primarily based on the use of the FLAG and HA peptide epitopes, with a particular emphasis on factors affecting yield and specificity, as well as steps to implement an automated version of the TAP procedure. © 2019 by John Wiley & Sons, Inc.
Keywords: TAP; affinity purification; epitope tags; mass spectrometry; protein complex; protein-protein interaction.
© 2019 John Wiley & Sons, Inc.
Figures
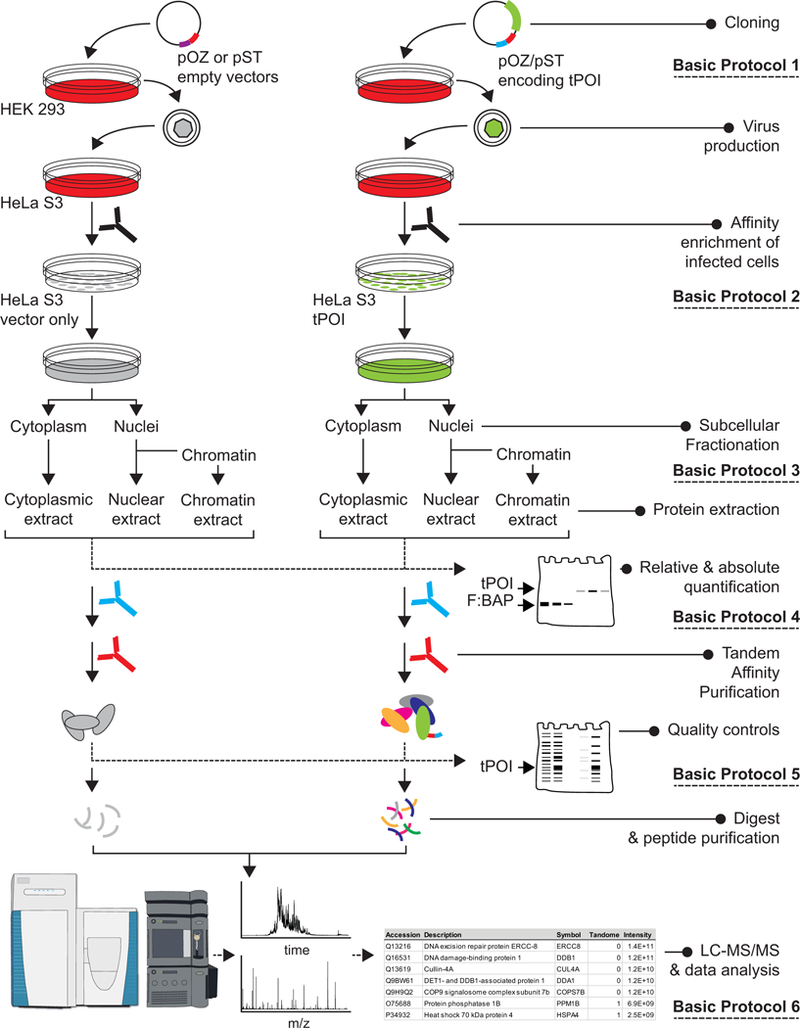
Overview of the Basic Protocols described in this section.

Workflow diagram of the subcellular fractionation protocol.

Relative expression of several tandem-tagged human proteins and their endogenous counterparts. Cytoplasmic and nuclear extracts were prepared from HeLa S3 cells expressing N-terminal FLAG:HA-tagged PRMT5, N-terminal FLAG:SII-tagged PRMT5, N-terminal FLAG:HA-tagged WDR77, N-terminal FLAG:SII-tagged hnRNPH1, and C-terminal FLAG:SII-tagged PSF. 12.5 µg of each subcellular fraction was loaded on the gel. Western blot detection was performed using commercial antibodies raised against the respective endogenous proteins.

Expression of several tandem-tagged human proteins relative to recombinant FLAG-tagged BAP. In addition to extracts described in Figure 1, cytoplasmic and nuclear extracts were prepared from HeLa-S3 cells expressing N-terminal FLAG:SII-tagged RIOK1. A serial dilution of FLAG-BAP was run alongside each fractionated cell extract (17.5 µg). Western blot detection was performed using an HRP-labeled anti-FLAG antibody.

Quality control (quantitative). Nuclear extracts (4 mg) from HeLa S3 cells expressing ERCC8:FLAG:HA were subjected to FLAG-IP (2.5 hrs.) and HA-IP (O/N). Samples for quality controls were taken at indicated purification steps and analyzed by western blot. Western blot detection was performed using an HRP-labeled anti-FLAG antibody.
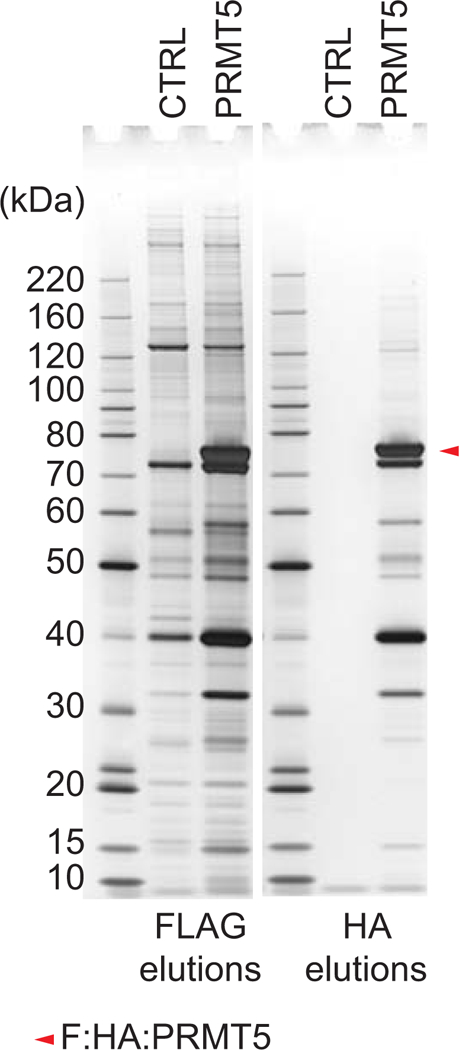
Quality control (qualitative). Cytoplasmic extracts (4 mg) from control (empty pOZ-N vector) HeLa S3 cells and from HeLa S3 cells expressing FLAG:HA:PRMT5 were subjected to FLAG-IP (2.5 hrs.) and HA-IP (O/N). Samples from the FLAG-IP elutions (5%) and from the HA-IP elutions (15%) were analyzed by silver staining.

Automated TAP on KingFisher. Nuclear extracts (2.4 mg) from control (empty pST-C vector) HeLa S3 cells and from HeLa S3 cells expressing PSF:FLAG:SII were subjected to automated FLAG-IP (3 hrs.) and SII-IP (3 hrs.). Samples from the FLAG-IP elutions (5%) and from the SII-IP elutions (15%) were analyzed by silver staining. The wells containing the control and PSF:FLAG:SII extracts are indicated in the plate schematic above the silver stain image.

Manual and Automated TAP comparison. Nuclear extracts (6.6 mg) from control (empty pOZ-C vector) HeLa S3 cells and from HeLa S3 cells expressing ERCC8:FLAG:HA were subjected to FLAG-IP (3 hrs.) and HA-IP (O/N). Samples from the manual (MAN.) and automated (KING.) FLAG-IP elutions (5%) and from the HA-IP elutions (15%) were analyzed by silver staining.
References
-
- Arsenis C, & McCormick DB (1964). Purification of Liver Flavokinase by Column Chromatography on Flavin-Cellulose Compounds. J Biol Chem, 239, 3093–3097. - PubMed
Publication types
MeSH terms
Substances
Grants and funding
LinkOut - more resources
Full Text Sources
Miscellaneous
