. 2019 Apr;597(7):1833-1853.
doi: 10.1113/JP277273. Epub 2019 Feb 27.

Cardiomyocyte substructure reverts to an immature phenotype during heart failure

Affiliations

Cardiomyocyte substructure reverts to an immature phenotype during heart failure

D B Lipsett et al. J Physiol. 2019 Apr.

Abstract

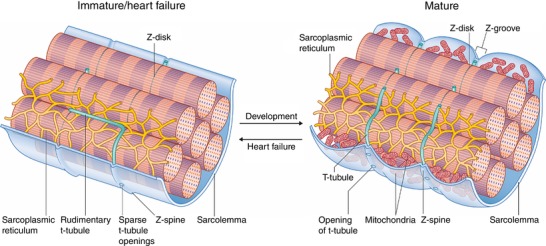
Key points: As reactivation of the fetal gene program has been implicated in pathological remodelling during heart failure (HF), we examined whether cardiomyocyte subcellular structure and function revert to an immature phenotype during this disease. Surface and internal membrane structures appeared gradually during development, and returned to a juvenile state during HF. Similarly, dyadic junctions between the cell membrane and sarcoplasmic reticulum were progressively 'packed' with L-type Ca2+ channels and ryanodine receptors during development, and 'unpacked' during HF. Despite similarities in subcellular structure, dyads were observed to be functional from early developmental stages, but exhibited an impaired ability to release Ca2+ in failing cardiomyocytes. Thus, while immature and failing cardiomyocytes share similarities in subcellular structure, these do not fully account for the marked impairment of Ca2+ homeostasis observed in HF.

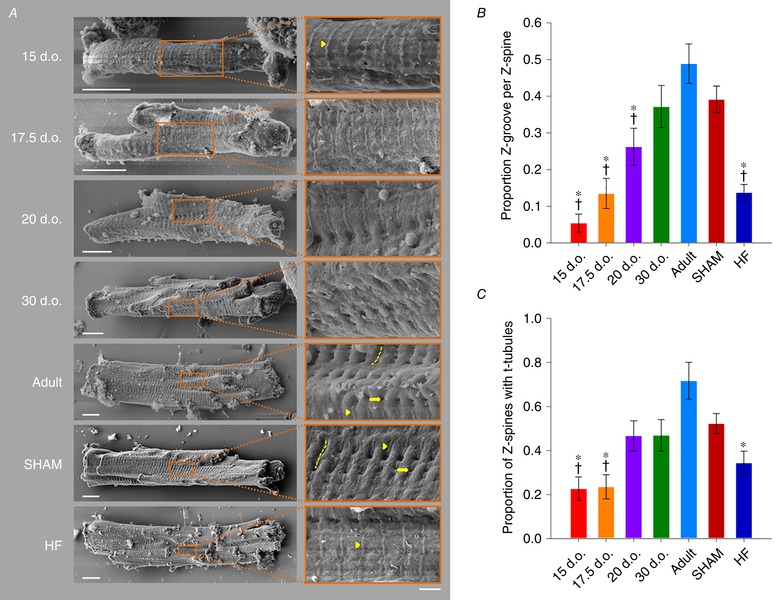
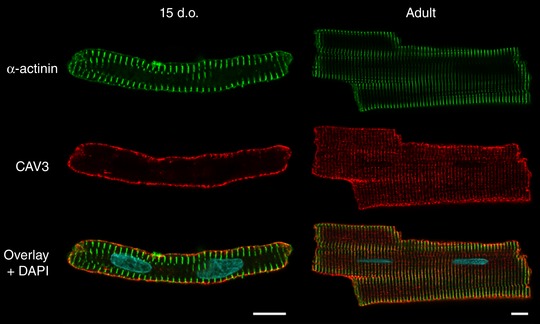
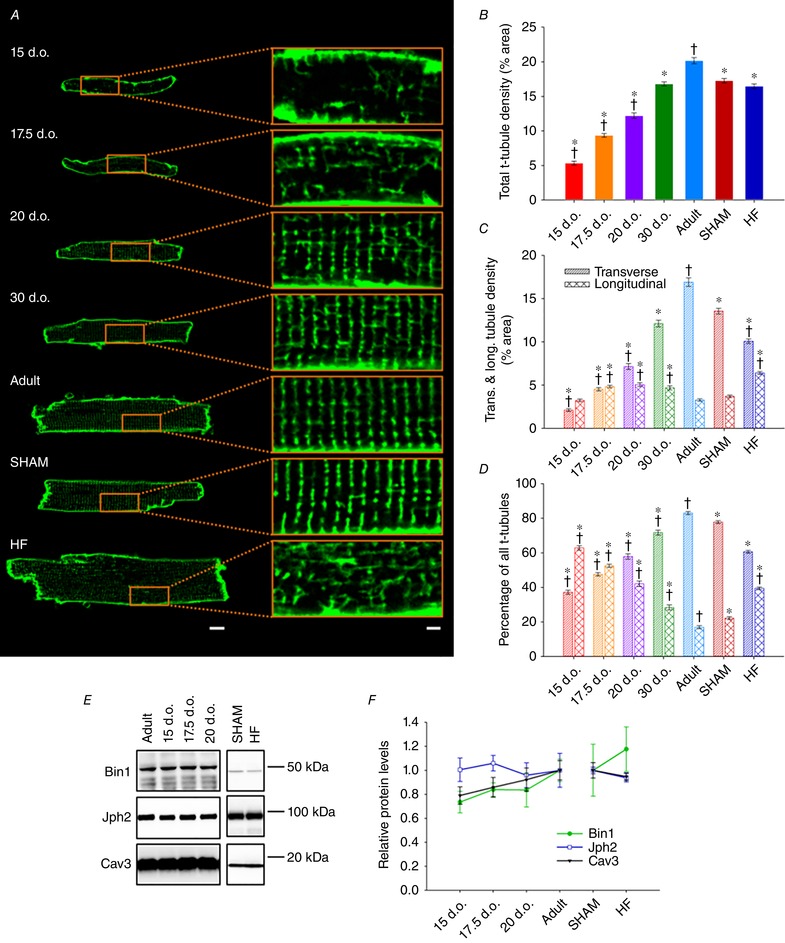
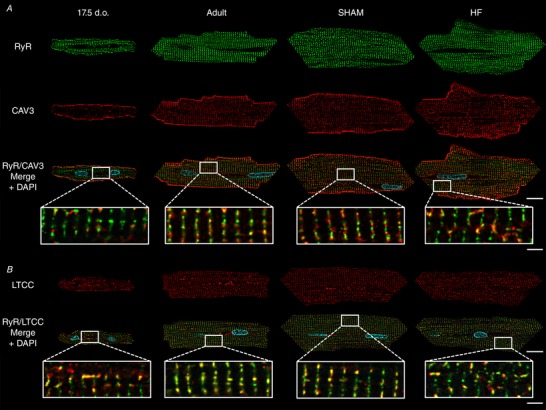
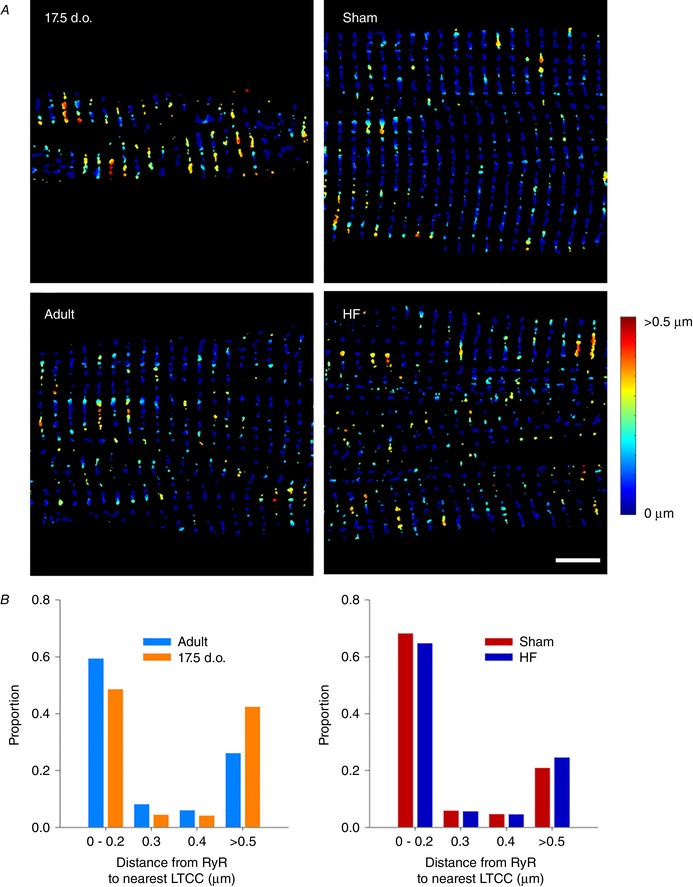
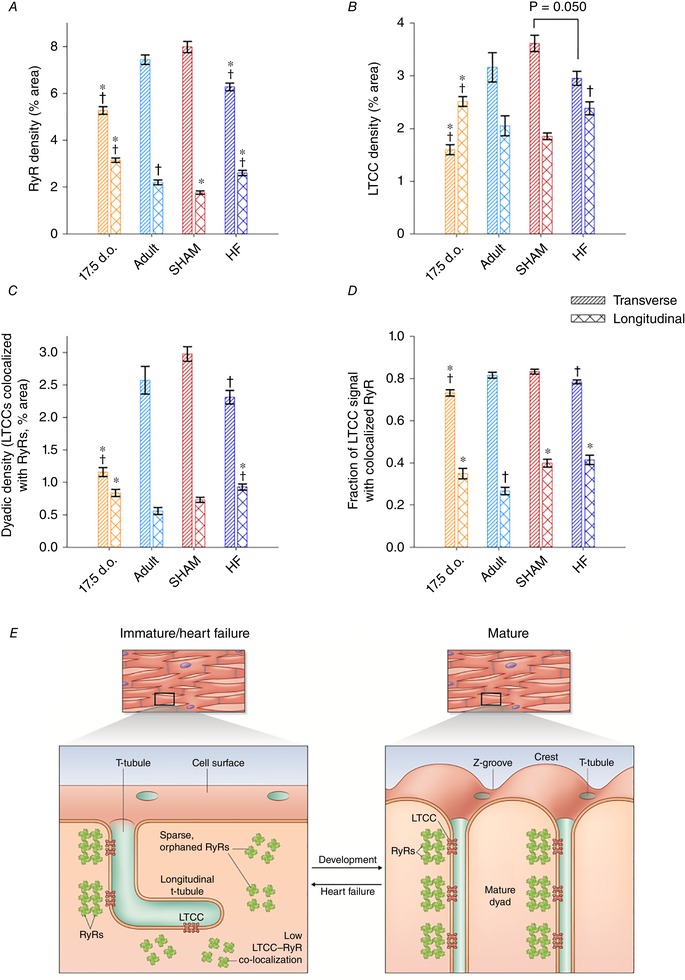
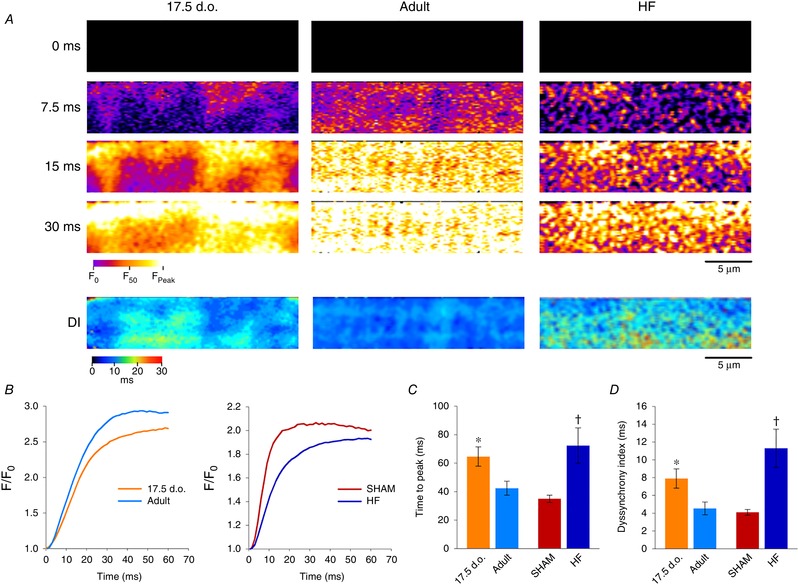
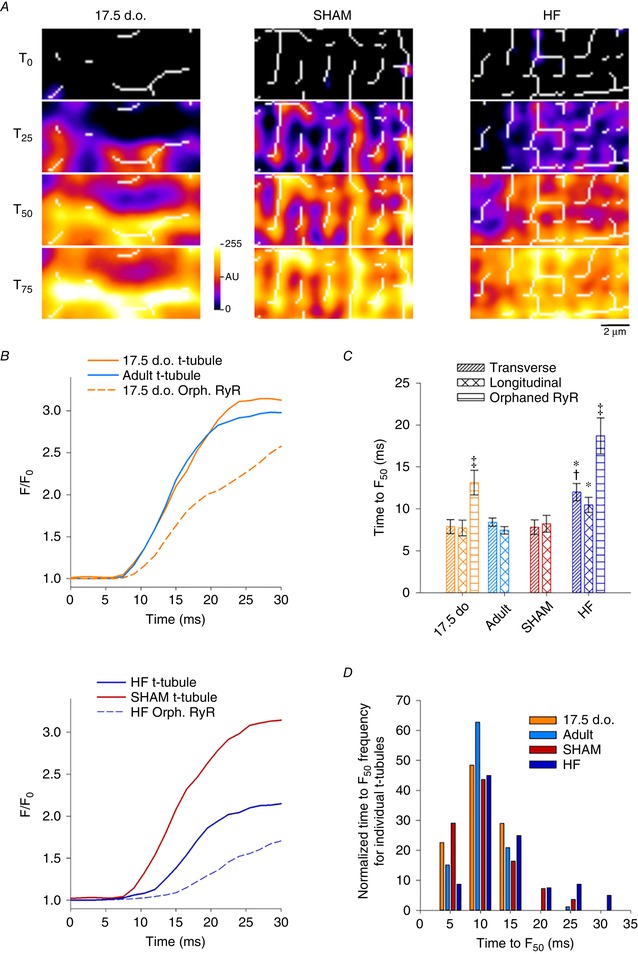
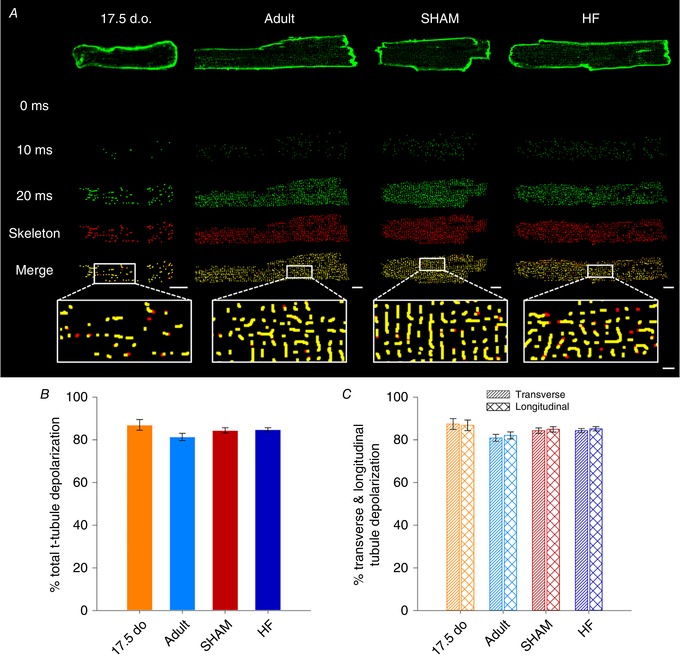
Abstract: Reactivation of the fetal gene programme has been implicated as a driver of pathological cardiac remodelling. Here we examined whether pathological remodelling of cardiomyocyte substructure and function during heart failure (HF) reflects a reversion to an immature phenotype. Using scanning electron microscopy, we observed that Z-grooves and t-tubule openings at the cell surface appeared gradually during cardiac development, and disappeared during HF. Confocal and super-resolution imaging within the cell interior revealed similar structural parallels; disorganization of t-tubules in failing cells was strikingly reminiscent of the late stages of postnatal development, with fewer transverse elements and a high proportion of longitudinal tubules. Ryanodine receptors (RyRs) were observed to be laid down in advance of developing t-tubules and similarly 'orphaned' in HF, although RyR distribution along Z-lines was relatively sparse. Indeed, nanoscale imaging revealed coordinated packing of L-type Ca2+ channels and RyRs into dyadic junctions during development, and orderly unpacking during HF. These findings support a 'last in, first out' paradigm, as the latest stages of dyadic structural development are reversed during disease. Paired imaging of t-tubules and Ca2+ showed that the disorganized arrangement of dyads in immature and failing cells promoted desynchronized and slowed Ca2+ release in these two states. However, while developing cells exhibited efficient triggering of Ca2+ release at newly formed dyads, dyadic function was impaired in failing cells despite similar organization of Ca2+ handling proteins. Thus, pathologically deficient Ca2+ homeostasis during HF is only partly linked to the re-emergence of immature subcellular structure, and additionally reflects lost dyadic functionality.

Keywords: calcium homeostasis; development; dyad; heart failure; t-tubule.


Figures

Figure 1
Figure 1. Remodelling of cardiomyocyte surface topography during development and heart failure
A, representative scanning electron micrographs of isolated cardiomyocytes, with enlargements shown at right. Z‐grooves (dashed lines) and t‐tubule openings (arrows) appeared gradually during development, and were lost during HF. However, Z‐spines (arrowheads), corresponding to points of attachment of the surface membrane to the Z‐disk, were readily apparent from early developmental stages and in HF. In healthy adult cardiomyocytes, these Z‐spines were localized along the base of Z‐grooves (scale bars for left panels: 10 μm, for right panels: 2 μm). B, quantification of Z‐groove presence relative to Z‐spines. C, proportion of the cell with visible t‐tubule openings along Z‐spines. n = 18, 17, 15, 16, 15, 33, 32 cells from 3, 3, 3, 3, 3, 3, 3 hearts in 15 d.o., 17.5 d.o., 20 d.o., 30 d.o., adult, SHAM and HF. * P < 0.05 vs. adult, †P < 0.05 vs. SHAM calculated with one‐way ANOVA with a post hoc Tukey test. d.o., days old.
Figure 2
Figure 2. Z‐disks are arranged during early stages of development
Representative confocal (Airyscan) images of immunolabelled cardiomyocytes show that the Z‐disk (α‐actinin staining) is present already at 15 days after birth, before the appearance of an organized t‐tubule network (caveolin‐3 staining). This observation supports the view that ‘Z‐spines’ observed by scanning electron microscopy at early stages of development (Fig. 1) likely result from points of attachment of the surface membrane with the Z‐disk. Scale bars: 10 μm. d.o., days old.
Figure 3
Figure 3. Summary of structural alterations to the surface and interior of cardiomyocytes during maturation and heart failure progression
Points of attachment of the Z‐disk to the surface membrane create ridges referred to as ‘Z‐spines’, which are present from early stages of development. Upon maturation, Z‐grooves are formed as the surface membrane adjacent to each Z‐spine bulges outward. Previous work has suggested that these membrane crests are created by the presence of mitochondria (Poche, 1969; Kaprielian et al. 2000; Pasek et al. 2008). T‐tubules also appear gradually during development. These are initially apparent at the cell surface as sparse openings along Z‐spines, with a rudimentary internal structure that is largely longitudinal in orientation. With further maturation, the t‐tubules assume a denser and more transverse arrangement. During heart failure, both surface and internal structure revert to an immature phenotype. This remodelling includes loss of the dense, transversely oriented t‐tubule structure and flattening of the cell surface as Z‐grooves disappear.
Figure 4
Figure 4. Spatial similarities between immature and pathologically remodelled t‐tubule networks
A, representative confocal micrographs of isolated cardiomyocytes stained with di‐8‐ANEPPS for viewing t‐tubules, with enlargements shown at right (scale bars for left panels: 10 μm, for right panels: 2 μm). B, quantification revealed progressively increasing t‐tubule density during maturation, but no difference in t‐tubule density between SHAM and HF groups. C, longitudinal t‐tubules comprise the majority of early t‐tubule networks and are gradually replaced by transverse elements. D, HF is associated with re‐emergence of longitudinal t‐tubules while transverse elements are lost, producing a t‐tubule network reminiscent of immature cardiomyocytes. n = 62, 79, 56, 52, 72, 121, 166 cells from 4, 5, 4, 3, 3, 3, 4 hearts in 15 d.o., 17.5 d.o., 20 d.o., 30 d.o., adult, SHAM and HF. E, representative western blot portraying the levels of Bin1, Jph2 and Cav3 during development and HF. F, key regulators of t‐tubule growth and dyadic integrity were not significantly altered during either development or HF. For developmental time points (all proteins), n = 5, 5, 5, 6 hearts for 15 d.o., 17.5 d.o., 20 d.o. and adult. n (Bin1) = 6 and 6, n (Cav3) = 5 and 6, n (Jph2) = 4 and 4 hearts for SHAM and HF. * P < 0.05 vs. adult in same category, †P < 0.05 vs. SHAM in same category. All groups were compared by one‐way ANOVA with a post hoc Tukey test, with the exception of SHAM and HF in (E), which were compared via two‐tailed t test. d.o., days old.
Figure 5
Figure 5. Representative super‐resolution confocal micrographs illustrating organization of cardiac dyads during development, adulthood and heart failure
Isolated cardiomyocytes were immunolabelled with antibodies against RyRs in combination with either caveolin‐3 (A), to label t‐tubules, or LTCCs (B) and imaged using Airyscan super‐resolution confocal microscopy. A sparse network of ‘orphaned’ RyRs was observed to precede the arrival of t‐tubules and LTCCs along Z‐lines in developing cells. These orphaned RyRs reappeared during HF. However, where present, LTCCs were observed to be highly colocalized with RyRs, particularly along Z‐lines. Scale bars for left panels: 10 μm, for right panels: 2 μm. d.o. = days old.
Figure 6
Figure 6. Calculation of RyR–LTCC distances
A, thresholded Airyscan images were employed to calculate distance from RyR positions to nearest LTCCs, as indicated by the colour code (scale bar: 5 μm). B, in comparison with adult cardiomyocytes, developing cells exhibited a significantly right‐shifted distribution, consistent with a greater fraction of orphaned RyRs (P < 0.05 by t test). A similar tendency was observed in failing cells compared to Sham‐operated controls. n = 15, 15, 15, 15 cells from 3, 3, 3, 3 hearts in 17.5 d.o., adult, Sham and HF.
Figure 7
Figure 7. Packing and unpacking of dyads during development and heart failure
A, RyR networks undergo considerable remodelling during development, as transverse elements replace longitudinal clusters. Conversely, transverse RyR clusters are lost while longitudinal clusters are gained during HF. B, a similar pattern of LTCC localization was observed, mirroring changes in t‐tubule morphology during development and HF (Fig. 4). C, colocalization analyses confirmed an increasing density of transversely localized dyads during development which is reversed during HF. D, the proportion of LTCCs colocalized with RyRs was always high along Z‐lines (transverse elements), indicating coordinated packing of these proteins into dyads during development and unpacking during HF. Of note, lower LTCC–RyR colocalization was observed along longitudinal t‐tubules of all cell types, suggesting that these structures have an immature dyadic makeup. E, observed similarities in cardiomyocyte substructure during development and disease are summarized in the schematic representaions. n = 44, 40, 39, 37 cells from 3, 3, 3, 3 hearts in 17.5 d.o., adult, SHAM and HF. * P < 0.05 vs. adult in same category, †P < 0.05 vs. SHAM in same category calculated with one‐way ANOVA with a post hoc Tukey test. d.o., days old.
Figure 8
Figure 8. Immature and failing cardiomyocytes exhibit slow, dyssynchronous Ca2+ transients
A, representative 2D confocal scans are presented from developing, adult and HF myocytes, at selected time frames during the early phase of the Ca2+ transient (fluo‐4 AM). Full videos are provided (Supporting information, Videos S1 and S2). More dyssynchronous Ca2+ release was observed in immature and failing cardiomyocytes, as highlighted by dyssynchrony index (DI) maps illustrating the time to half‐maximal fluorescence across the cell (lower panels). B, representative traces of Ca2+ transients from all groups. C and D, quantification of Ca2+ release kinetics confirmed that transients from immature and failing cardiomyocytes are both slower (C) and more dyssynchronous (D) than their respective controls. For time to peak: n = 18, 15, 13, 14 from 6, 3, 5, 5 hearts for 17.5 d.o., adult, SHAM and HF. For DI: n = 18, 15, 13, 11 from 6, 3, 5, 4 hearts for 17.5 d.o., adult, SHAM and HF. * P < 0.05 compared to adult; †P < 0.05 compared to SHAM. DI, dyssynchrony index; d.o., days old.
Figure 9
Figure 9. T‐tubules effectively trigger Ca2+ release in immature but not failing cardiomyocytes
A, overlay of 2D Ca2+ release patterns and skeletonized t‐tubule networks from representative 2D confocal videos (as in Fig. 8). Local Ca2+ release was examined within small (1 × 1 μm) regions corresponding to intact transverse or longitudinal t‐tubules, or orphaned sites. B, representative local transients show rapid Ca2+ release along t‐tubules in developing and healthy adult cells, but slowed Ca2+ rise at t‐tubules in HF cardiomyocytes. As expected, orphaned RyR sites exhibited delayed Ca2+ release in both developing and failing cells, dependent on Ca2+ propagation from intact dyads. C and D, time to half‐maximal fluorescence (TTF50) measurements confirmed loss of t‐tubule functionality in HF. For the purpose of display, local transients were smoothed with a 5 point moving average to reduce noise. n transverse = 17, 46, 31, 38; n longitudinal = 14, 40, 24, 42; n OrphRyR = 14, 0, 0, 33 from 4, 3, 3, 6 hearts in 17.5 d.o., adult, SHAM and HF. * P < 0.05 vs. adult in same category, †P < 0.05 vs. SHAM in same category, ‡P < 0.05 vs. transverse and longitudinal tubule in same group. Significance was calculated by one‐way ANOVA with a post hoc Tukey test. d.o., days old.
Figure 10
Figure 10. Action potential propagation is not deficient along immature or failing t‐tubule networks
A, representative 2D confocal images of isolated cardiomyocytes loaded with FluoVolt, at selected time points following the onset of electrical stimulation. Shown below each times series is the cell's skeletonized t‐tubule network (red), and the proportion of t‐tubules for which fluorescence increased above threshold (Otsu) during the action potential (green). B and C, similar extents of t‐tubule depolarization were observed in developing, adult and HF cardiomyocytes. n = 15, 35, 54, 77 cells from 6, 3, 5, 4 hearts for 17.5 d.o., adult, SHAM and HF. Differences between groups were compared via one‐way ANOVA. d.o., days old.

Comment in

  • Letter to the Editor.
    Crocini C, Ferrantini C, Coppini R, Pavone FS, Poggesi C, Cerbai E, Sacconi L. Crocini C, et al. J Physiol. 2019 Jun;597(11):2965-2966. doi: 10.1113/JP278018. Epub 2019 Apr 14. J Physiol. 2019. PMID: 30924149 No abstract available.
  • Reply from M. Frisk, D. B. Lipsett and W. E. Louch.
    Frisk M, Lipsett DB, Louch WE. Frisk M, et al. J Physiol. 2019 Jun;597(11):2967-2968. doi: 10.1113/JP278067. Epub 2019 May 12. J Physiol. 2019. PMID: 31021407 No abstract available.

References

    1. Aronsen JM, Espe EK, Skardal K, Hasic A, Zhang L & Sjaastad I (2017). Non‐invasive stratification of postinfarction rats based on degree of cardiac dysfunction using magnetic resonance imaging and echocardiography. Am J Physiol Heart Circ Physiol 312, H932–H942. - PubMed
    1. Bers DM (2002). Cardiac excitation–contraction coupling. Nature 415, 198–205. - PubMed
    1. Brook WH, Connell S, Cannata J, Maloney JE & Walker AM (1983). Ultrastructure of the myocardium during development from early fetal life to adult life in sheep. J Anat 137, 729–741. - PMC - PubMed
    1. Bryant SM, Kong CHT, Cannell MB, Orchard CH & James AF (2018). Loss of caveolin‐3‐dependent regulation of I Ca in rat ventricular myocytes in heart failure. Am J Physiol Heart Circ Physiol 314, H521–H529. - PMC - PubMed
    1. Bryant SM, Kong CH, Watson J, Cannell MB, James AF & Orchard CH (2015). Altered distribution of ICa impairs Ca release at the t‐tubules of ventricular myocytes from failing hearts. J Mol Cell Cardiol 86, 23–31. - PMC - PubMed

Publication types

Substances