

BCL::MolAlign: Three-Dimensional Small Molecule Alignment for Pharmacophore Mapping
- PMID: 30707580
- PMCID: PMC6598199
- DOI: 10.1021/acs.jcim.9b00020
BCL::MolAlign: Three-Dimensional Small Molecule Alignment for Pharmacophore Mapping
Abstract
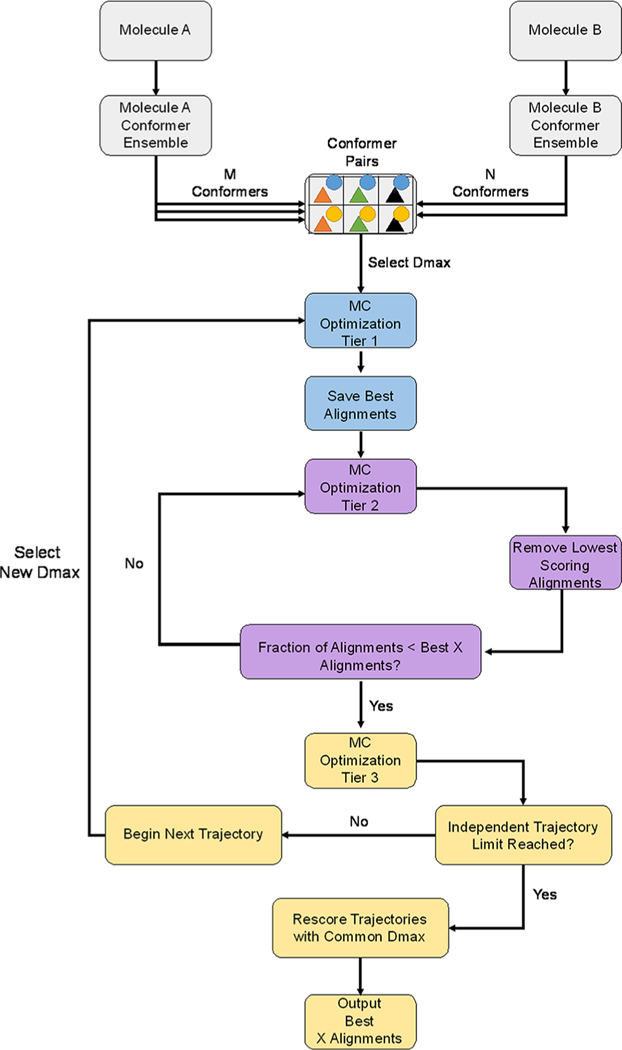
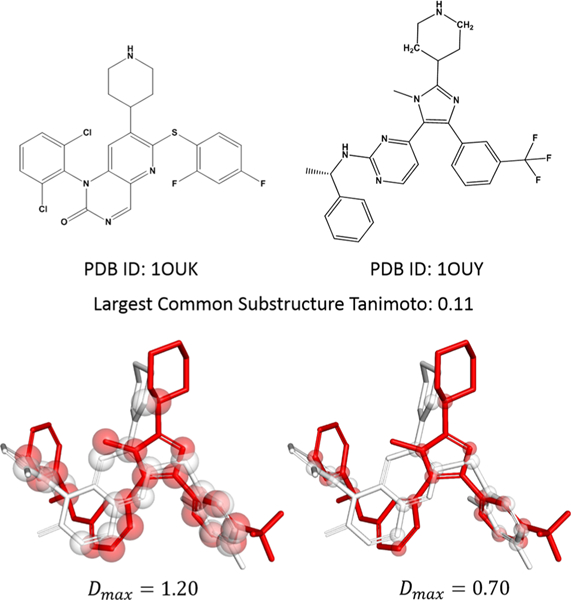
Small molecule flexible alignment is a critical component of both ligand- and structure-based methods in computer-aided drug discovery. Despite its importance, the availability of high-quality flexible alignment software packages is limited. Here, we present BCL::MolAlign, a freely available property-based molecular alignment program. BCL::MolAlign accommodates ligand flexibility through a combination of pregenerated conformers and on-the-fly bond rotation. BCL::MolAlign converges on alignment poses by sampling the relative orientations of mutually matching atom pairs between molecules through Monte Carlo Metropolis sampling. Across six diverse ligand data sets, BCL::MolAlign flexible alignment outperforms MOE, ROCS, and FLEXS in recovering native ligand binding poses. Moreover, the BCL::MolAlign alignment score is more predictive of ligand activity than maximum common substructure similarity across 10 data sets. Finally, on a recently published benchmark set of 20 high quality congeneric ligand-protein complexes, BCL::MolAlign is able to recover a larger fraction of native binding poses than maximum common substructure-based alignment and RosettaLigand. BCL::MolAlign can be obtained as part of the Biology and Chemistry Library (BCL) software package freely with an academic license or can be accessed via Web server at http://meilerlab.org/index.php/servers/molalign .
Conflict of interest statement
The authors declare no competing financial interest.
Figures

References
-
- Wolber G; Seidel T; Bendix F; Langer T Molecule-Pharmacophore Superpositioning and Pattern Matching in Computational Drug Design. Drug Discovery Today 2008, 13, 23–29. - PubMed
-
- Vieth M; Hirst JD; Brooks CL III Do Active Site Conformations of Small Ligands Correspond to Low Free-Energy Solution Structures? J. Comput.-Aided Mol. Des. 1998, 12, 563–572. - PubMed
-
- Perola E; Charifson PS Conformational Analysis of Drug-Like Molecules Bound to Proteins: An Extensive Study of Ligand Reorganization Upon Binding. J. Med. Chem. 2004, 47, 2499–2510. - PubMed
-
- Hao M-H; Haq O; Muegge I Torsion Angle Preference and Energetics of Small-Molecule Ligands Bound to Proteins. J. Chem. Inf. Model. 2007, 47, 2242–2252. - PubMed
-
- Seo M-H; Park J; Kim E; Hohng S; Kim H-S Protein Conformational Dynamics Dictate the Binding Affinity for a Ligand. Nat. Commun. 2014, 5, No. 3724. - PubMed
Publication types
MeSH terms
Substances
Grants and funding
LinkOut - more resources
Full Text Sources
