. 2019 Apr;597(8):2225-2251.
doi: 10.1113/JP277082. Epub 2019 Mar 19.

The role of PHOX2B-derived astrocytes in chemosensory control of breathing and sleep homeostasis

Affiliations

The role of PHOX2B-derived astrocytes in chemosensory control of breathing and sleep homeostasis

Catherine M Czeisler et al. J Physiol. 2019 Apr.

Abstract

Key points: The embryonic PHOX2B-progenitor domain generates neuronal and glial cells which together are involved in chemosensory control of breathing and sleep homeostasis. Ablating PHOX2B-derived astrocytes significantly contributes to secondary hypoxic respiratory depression as well as abnormalities in sleep homeostasis. PHOX2B-derived astrocyte ablation results in axonal pathologies in the retrotrapezoid nucleus.

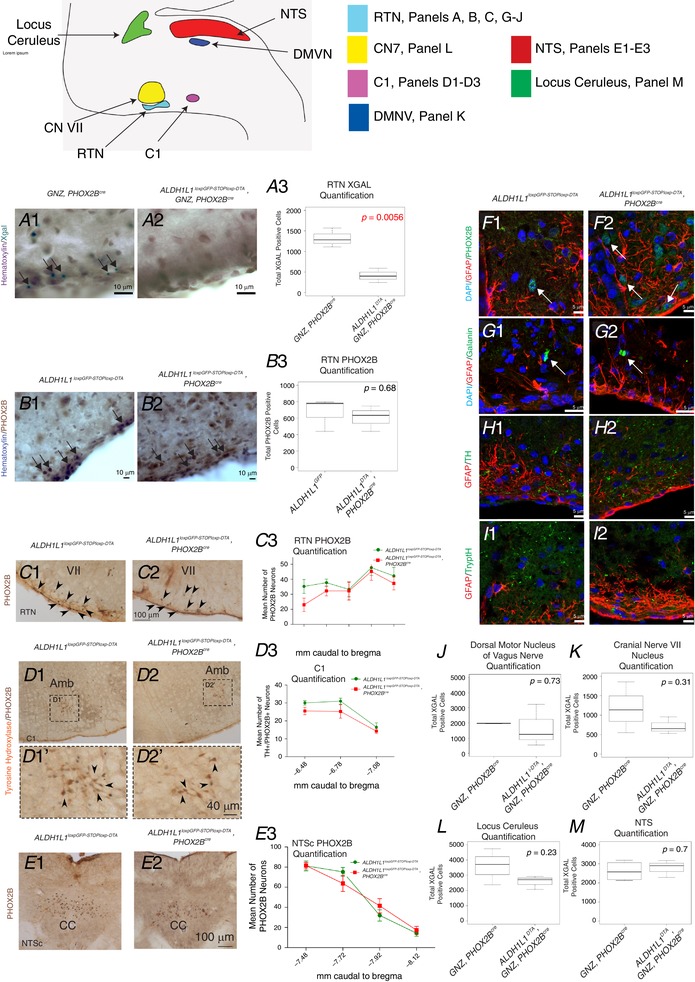
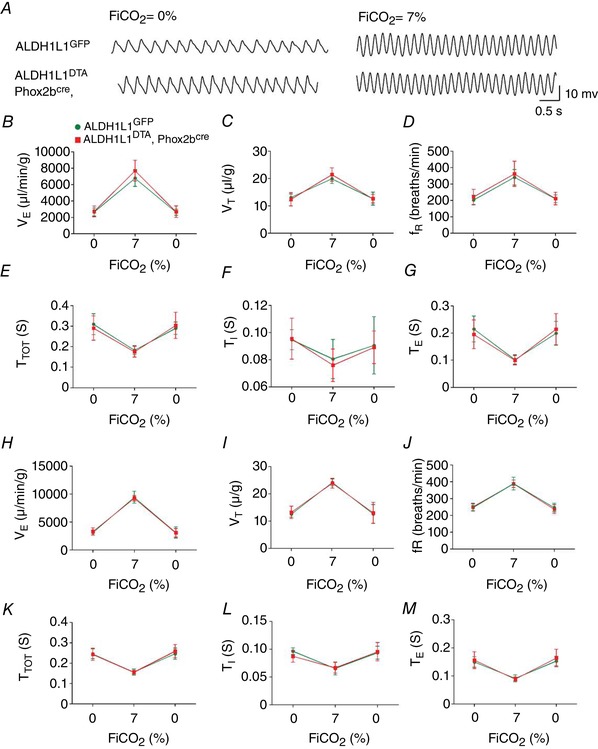
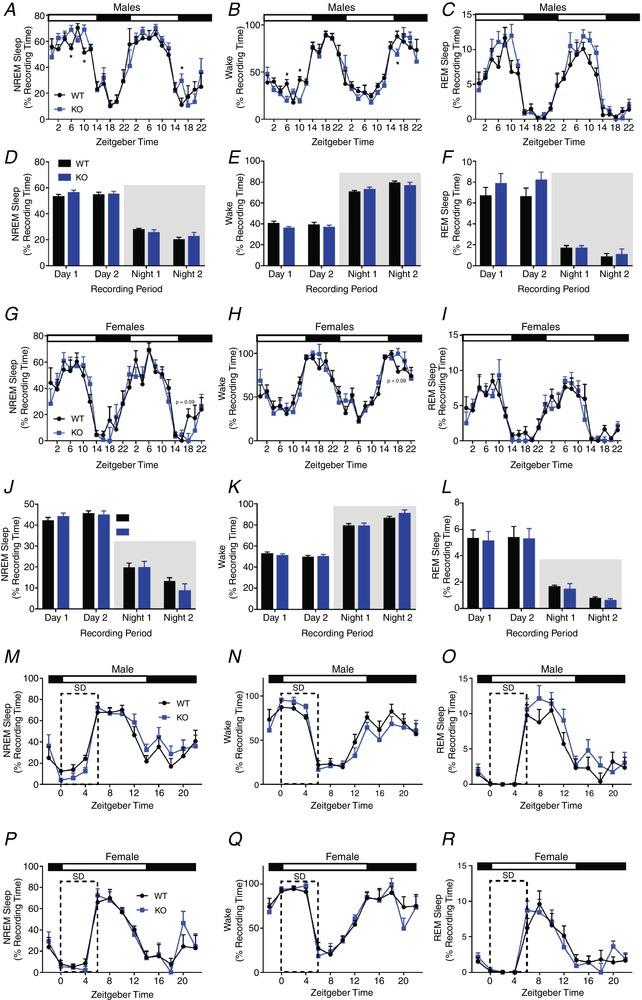
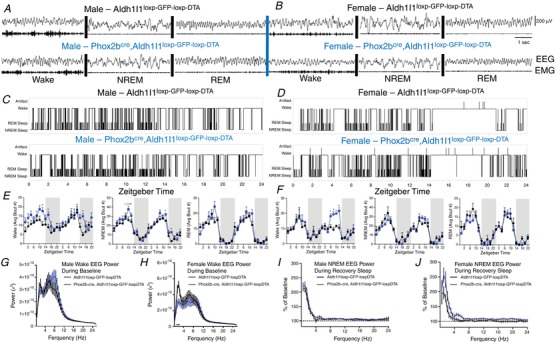
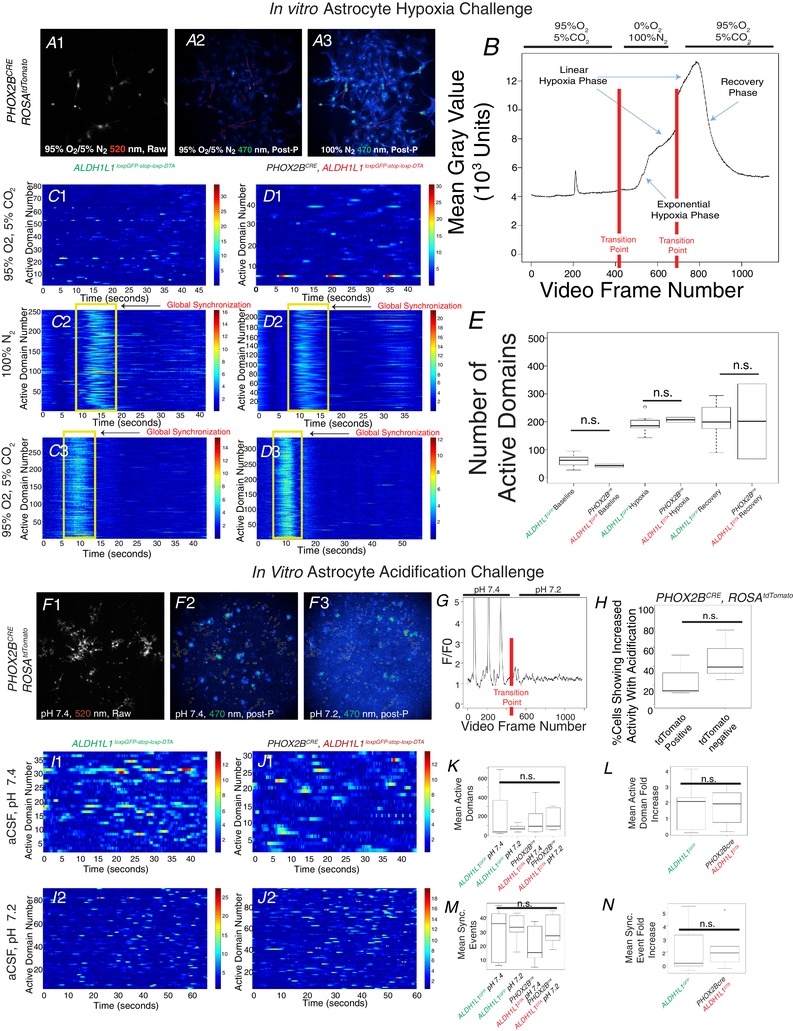
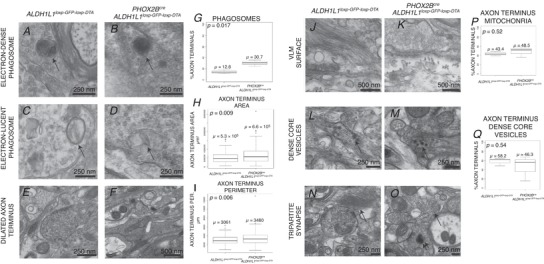
Abstract: We identify in mice a population of ∼800 retrotrapezoid nucleus (RTN) astrocytes derived from PHOX2B-positive, OLIG3-negative progenitor cells, that interact with PHOX2B-expressing RTN chemosensory neurons. PHOX2B-derived astrocyte ablation during early life results in adult-onset O2 chemoreflex deficiency. These animals also display changes in sleep homeostasis, including fragmented sleep and disturbances in delta power after sleep deprivation, all without observable changes in anxiety or social behaviours. Ultrastructural evaluation of the RTN demonstrates that PHOX2B-derived astrocyte ablation results in features characteristic of degenerative neuro-axonal dystrophy, including abnormally dilated axon terminals and increased amounts of synapses containing autophagic vacuoles/phagosomes. We conclude that PHOX2B-derived astrocytes are necessary for maintaining a functional O2 chemosensory reflex in the adult, modulate sleep homeostasis, and are key regulators of synaptic integrity in the RTN region, which is necessary for the chemosensory control of breathing. These data also highlight how defects in embryonic development may manifest as neurodegenerative pathology in an adult.

Keywords: Chemosensation; PHOX2B; Respiration; Sleep Homeostasis.


Figures

Figure 1
Figure 1. PHOX2B expression does not prohibit astrocyte generation
Embryonic stem cells were differentiated by dilution and retinoic acid through embryoid body formation (schematic diagram shown in A). Controls included wild‐type ES cells, and experimental ES cells contain a cassette that expresses PHOX2B under the control of the Nestin promoter (NestinPHOX2B). B and C represent confocal optical slices of embryoid bodies that underwent immunofluorescence analysis through whole‐mount staining. Molecular markers are denoted on the left‐hand side of each panel. Top right indicates days of differentiation in each step (embryoid body phase in B and C and post‐embryoid body dissociation and plating on matrigel in D and E. NF, neurofilament; EB, embryoid body). [Color figure can be viewed at wileyonlinelibrary.com]
Figure 2
Figure 2. Graphical depiction of transgenic mouse strategies
A, several lines of transgenic mice were used to obtain lineage tracing results for PHOX2B‐derived populations, including the ROSAmT/mG, a cell membrane‐targeted, two‐colour fluorescent Cre‐reporter allele. When bred to PHOX2B‐cre mice, cell membrane‐localized GFP (mGFP) fluorescence expression is widespread in PHOX2B‐expressing (cre‐recombined) cells. B, the ROSAloxP‐STOP‐loxP‐tdTomato reporter mice harbour a loxP‐flanked STOP cassette preventing transcription of a CAG promoter‐driven red fluorescent protein variant (tdTomato). TdTomato is expressed in PHOX2B‐derived tissues when bred to PHOX2B‐Cre mice. C, the RC::FrePe dual‐recombinase responsive fluorescent allele has a frt‐flanked STOP and loxP‐flanked mCherry::STOP all preventing transcription of eGFP. FLP recombinase (by breeding with PHOX2B‐flp mice) results in mCherry fluorescence, and further exposure to Cre recombinase (by breeding with ALDH1L1‐cre mice) results in eGFP fluorescence in the overlapping populations. Two recombination events are possible, namely (1) in which the PHOX2B promoter is first turned on, resulting in red fluorescence, followed by the ALDH1L1 promoter, resulting in green fluorescence, or (2) which consists of ALDH1L1 turning on first, with no resulting fluorescence, followed by PHOX2B, resulting in green fluorescence. D, in this PHOX2B‐derived astrocyte ablation strategy, we used a transgenic strain where ALDH1L1 promoter‐active cells in the brain and spinal cord (the majority being astrocytes) express EGFP. Crossing with PHOX2B‐cre mice results in Cre‐mediated excision of the floxed EGFP/Stop enabling DTA‐mediated ablation of these cells. E, for labelling single PHOX2B‐derived cells we used GNZ knock‐in mice which have widespread expression of a nuclear‐localized green fluorescent protein/beta‐galactosidase fusion protein (GFP‐NLS‐lacZ or GNZ) upstream of loxP‐flanked STOP sequence. When bred to PHOX2Bcre‐expressing mice, the resulting GNZ fusion protein expression in the offspring allows for enhanced (single cell level) visualization. [Color figure can be viewed at wileyonlinelibrary.com]
Figure 3
Figure 3. PHOX2B‐derived astrocytes identified in vivo
Genotypes are on the top of each panel series, and molecular markers are illustrated on the left. A shows a low magnification, optically cleared specimen stained with GFAP (green) and showing endogenous tdTomato expression that was manually tiled. BD are higher magnification images of this specimen, illustrating a small quantity of PHOX2B‐derived astrocytes located on the ventral medullary surface. E, a photomicrograph captured from the RTN region of an animal showing post‐cre‐mediated, constitutive expression of a membrane‐tethered GFP protein (green); the sections were also stained with GFAP (pseudo‐coloured in red) showing PHOX2B‐derived astrocytes in yellow. F1, cre‐mediated recombination induces expression of GFP fused to β‐galactosidase. Note the GFP‐positive astrocyte on the edge of the medullary surface. F2, ablation of PHOX2B‐derived astrocytes does not abrogate expression of PHOX2B‐derived neurons (F2, arrow) yet removes the PHOX2B‐derived astrocytes from the medullary surface. G, low power view of an intersectional transgenic mouse experiment, which results in tdTomato expression following flp‐mediated recombination, and GFP expression following recombination by both flp‐ and cre‐recombinase. Flp was under the PHOX2B promoter, whereas the astrocyte marker ALDH1L1 controls cre‐expression. PHOX2B‐derived/ALDH1L1‐derived cells are labelled in green. Two high magnification confocal slice series are shown in H1–I3, and show intimate associations between PHOX2B‐derived/ALDH1L1‐derived cells and PHOX2B‐derived cells. [Color figure can be viewed at wileyonlinelibrary.com]
Figure 4
Figure 4. Mapping of glial populations
Genotypes displayed on the top, and colour‐coded molecular markers on the left. A, sections of the ventral medulla at the RTN/pFRG level from OLIG3cre, ROSAtdTomato mice show no contribution to ventral medullary astrocytes. B, in contrast, the NKX2.2cre, ROSAtdTomato animals show robust contribution of astrocytes to the RTN/pFRG. C, coronal section of rhombomere 4 (r4) at E10.5 stained with ALDH1L1 and PHOX2B. , inset showing that progenitors that ultimately give rise to ventral medullary PHOX2B‐derived cells do not express Aldh1L1 (image captured from the ventral neuroepithelium, spanning the pMNv domain. Note PHOX2B expression in mitotic cells (arrows). D, coronal section of VZ/SVZ stem cell populations that give rise to cortical neurons and glia. Dʹ, inset showing positive controls for ALDH1L1 immunostaining. [Color figure can be viewed at wileyonlinelibrary.com]
Figure 5
Figure 5. Ablation of PHOX2B‐derived astrocytes results in cell loss only in the RTN/pFRG area of the ventral lateral medulla
A colour‐coded schematic diagram of the different nuclei analysed is shown above the panels. RTN data is shown in panels A, B, C, F and I; CNVII data is shown in panel K; DMNV data is shown in panel J, NTS data is shown in panels E1–3, and M. Locus coeruleus is shown in panel L. Genotypes are denoted on top row, and molecular marker evaluation is colour‐coded on the left‐hand side of each panel. In FI, all cells show DAPI in blue to label nuclei. In panel A, Haematoxylin incubation was performed without the ‘blueing’ step so as to provide enhanced contrast between the aqua‐green X‐GAL reaction and nuclei. All X‐GAL quantifications were performed on P21 mice. Quantifications of panels A3, B3, and JM, show on the y‐axis the total number of cells (bilaterally quantified in all structures by unbiased stereology). The box of the whisker plot represents the interquartile range, the black bar represents the median, the whiskers represent 1.5× the interquartile range, and the P value of a Student's t test is denoted in the top right corner of each box‐whisker plot. Quantifications of panels C3, D3, and E3 show serial section quantifications (y‐axis) relative to bregma (x‐axis). Panels B and F are goat‐anti‐PHOX2B, whereas panels CE are rabbit anti‐PHOX2B antibody. Photomicrographs of structures quantified in panels JM are shown in Fig. S1 in Supporting information. [Color figure can be viewed at wileyonlinelibrary.com]
Figure 6
Figure 6. Hypoxic ventilatory response in juvenile and adult mice following PHOX2B‐derived astrocyte ablation
A, recordings showing the effect of PHOX2B‐derived astrocyte ablation under normoxia and hypoxia (8% O2). BG, changes in minute ventilation (V˙E, ml kg min–1) (B), tidal volume (V T, ml kg–1) (C), respiratory frequency (f R, breaths min–1) (D), total respiratory cycle (T TOT, s) (E), inspiratory time (T I, s) (F) and expiratory time (T E, s) (G) in adult conscious ALDH1L1loxp‐GFP‐STOP‐loxp‐DTA and PHOX2Bcre, ALDH1L1loxp‐GFP‐STOP‐loxp‐DTA mice under normoxia or hypoxic condition. HM, changes in minute ventilation (V˙E, ml kg–1 min–1) (H), tidal volume (V T, ml kg–1) (I), respiratory frequency (f R, breaths min–1) (J), total respiratory cycle (T TOT, s) (K), inspiratory time (T I, s) (L) and expiratory time (T E, s) (M) in juvenile conscious ALDH1L1loxp‐GFP‐STOP‐loxp‐DTA and PHOX2Bcre, ALDH1L1loxp‐GFP‐STOP‐loxp‐DTA mice under normoxia or hypoxic conditions. *Different from ALDH1L1loxp‐GFP‐STOP‐loxp‐DTA (control) (two‐way ANOVA, P < 0.05); n = 5/group of mice. [Color figure can be viewed at wileyonlinelibrary.com]
Figure 7
Figure 7. Hypercapnic ventilatory response in juvenile and adult mice following PHOX2B‐derived astrocyte ablation
A, recordings showing the effect of PHOX2B‐derived astrocyte ablation under normocapnia and hypercapnia (7% CO2). BG, changes in minute ventilation (V˙E, ml kg–1 min–1) (B), tidal volume (V T, ml kg–1) (C), respiratory frequency (f R, breaths min–1) (D), total respiratory cycle (T TOT, s) (E), inspiratory time (T I, s) (F) and expiratory time (T E, s) (G) in adult conscious ALDH1L1loxp‐GFP‐STOP‐loxp‐DTA and PHOX2Bcre, ALDH1L1loxp‐GFP‐STOP‐loxp‐DTA mice under normocapnia or hypercapnic condition. HM, changes in minute ventilation (V˙E, ml kg–1 min–1) (H), tidal volume (V T, ml kg–1) (I), respiratory frequency (f R, breaths min–1) (J), total respiratory cycle (T TOT, s) (K), inspiratory time (T I, s) (L) and expiratory time (T E, s) (M) in juvenile conscious ALDH1L1loxp‐GFP‐STOP‐loxp‐DTA and PHOX2Bcre, ALDH1L1loxp‐GFP‐STOP‐loxp‐DTA mice under normocapnia or hypercapnic condition. *Different from ALDH1L1loxp‐GFP‐STOP‐loxp‐DTA (control) (two‐way ANOVA, P < 0.05); n = 6/group of mice. [Color figure can be viewed at wileyonlinelibrary.com]
Figure 8
Figure 8. Defective recovery after hyperoxic hypercapnic challenge in mice following PHOX2B‐derived astrocyte ablation
A, protocol for hyperoxic hypercarpnia. B, plot of response of hyperoxic‐hypercapnic response. See Methods section for methodology. CI show the defective respiratory pattern. Subpanels 1 and 2 in panels C–H represent the entire recording period, unfiltered, of two representative animals. As shown in the key of C1, baseline is black, hyperoxia is brown, hyperoxic hypercapnia is red, and recovery is in blue. Genotype is on top, and the parameter tested in on the bottom. Panels C3, D3, E3, F3, G3, and I3 plot the best fit curve of the kernel density distribution. Genotypes are colour coded in the top of C3, with PHOX2B‐derived astrocyte ablated animals shown in blue. The baseline measurements are plotted for each of the parameters in C4, D4, E4, F4 and G4. I4 shows the arithmetic mean of the rejection index during the recovery period. f, frequency; V T, tidal volume; V˙E, minute ventilation; T I, inspiratory time; T E, expiratory time; EF50, mid expiratory flow. [Color figure can be viewed at wileyonlinelibrary.com]
Figure 9
Figure 9. Sleep analysis in PHOX2B‐astrocyte‐ablated mice
Percentage of time spent in each vigilance state is plotted for males (AF) and females (GL). PHOX2B‐derived astrocyte ablation does not alter amount of time spent in NREM (A, G) wake (B, H), or REM sleep (C, I) in male (AF) or female (GL) mice. Error bars represent SEM, n = 4/sex/genotype, * P < 0.05 Student's t test. PHOX2B‐derived astrocyte ablation does not alter the normal REM or wake phases following sleep deprivation. Mice were sleep deprived (denoted by ‘SD’ in panels) via gentle handling for 6 h starting at ‘lights on’ (ZT 0), when sleep pressure was high. Male (MO) and female (PR) time spent (per 2 h bin) in each vigilance state during sleep deprivation and recovery was not different between genotypes. The spectral components of the EEG were analysed during 0—6 h following sleep deprivation (recovery sleep; ZT 6–12). Neither males (C and D) nor females (G and H) showed changes in the spectral components of wake or REM states during recovery sleep. Error bars represent SEM, n = 4/sex/genotype. [Color figure can be viewed at wileyonlinelibrary.com]
Figure 10
Figure 10. PHOX2B‐derived astrocyte ablation results in moderate vigilance state fragmentation, reduced delta power during waking in female mice and increased delta power in females after sleep deprivation
A and B, representative 5 s EEG/EMG traces from male (A) and female (B) mice from each genotype. Each trace is accompanied by the corresponding vigilance state (‘wake’, ‘NREM’, or ‘REM’). C and D, representative hypnograms of day 2 baseline recordings for male (C) and female (D) mice from each genotype. Notice that the mutants have more transitions between vigilance states. E, male PHOX2B‐astrocyte ablated animals (blue line) demonstrate increased bout numbers in wakefulness (day 1: ZT 12 t = 2.715, P = 0.035; ZT 16 t = 2.861, P = 0.023; day 2: ZT 14 t = 4.8, P = 0.003) and NREM sleep (day 2: ZT 12 t = 4.626, P = 0.0036; ZT 16 t = 6.302, P = 0.0007). F, female PHOX2B‐astrocyte ablated mice show more pronounced changes in wakefulness bouts (day 2: ZT 6 t = 3.073, P = 0.02; ZT 8 t = 3.976, P = 0.007; ZT 10 t = 9.658, P = 0.00007; ZT 12 t = 3.754, P = 0.009). G and H, no changes were observed in the spectral power (during all of baseline recording) of wake state in male mice (G), but we did observe altered wake spectral power in female PHOX2B astrocyte‐ablated mice (H). Deletion of PHOX2B‐derived astrocytes alters the homeostatic response to sleep deprivation in female mice. NREM spectral power during 0–6 h following sleep deprivation compared to baseline data collected at the same time on the previous day in male (I) and female (J) mice. Female mice lacking these astrocytes show enhanced delta (slow wave) power in response to a 6 h sleep deprivation protocol. Error bars represent SEM; n = 4/group/genotype. Frequencies 1.5 Hz, t = 2.716; P = 0.035; 2 Hz, t = 3.573, P = 0.012. Error bars represent SEM, n = 4/sex/genotype, * P < 0.05, Student's t test). [Color figure can be viewed at wileyonlinelibrary.com]
Figure 11
Figure 11. Chemosensory analysis of PHOX2B‐derived astrocytes in vitro
In A, PHOX2B‐derived astrocytes were identified by tdTomato expression (see genotype on left) identified by image capture of LED‐illuminated samples (see wavelength on bottem left of panel). A1 shows one image capture baseline live cells perfused with carbogen gas as a raw black and white image. A2 and A3 show Z‐projection of summed activity during baseline carbogen recording or hypoxia recording, respectively. In B, we graph a common waveform identified in individual cells with mean grey value on the y‐axis and video frame number on the x‐axis (1 frame per 100 ms); red lines demonstrate transition points where movie recording was stopped to institute the different perfusate (indicated on top of graph). No differences were found between PHOX2B‐derived astrocytes and non‐PHOX2B‐derived astrocytes. In panels CD, brainstem astrocyte cultures derived from animals were analysed for global synchronization of the culture with the genotypes delineated on top, and perfusate condition delineated on the left (D denotes experiments with PHOX2B‐derived astrocytes depleted from the culture.) In these raster plots, changes in fluorescence are shown by the blue‐red colour spectrum (to the right of each graph), the x‐axis shows time, and the y‐axis is active domain number, which corresponds to cells that showed fluctuations in intracellular calcium. Note that during hypoxia (C2 and D2), massive global synchronization is noted during hypoxia (yellow box) and an increase in active domains is detected during this recording period. In C3 and D3, we also noted a massive global synchronization during the return to normoxia. We did not find a difference in the active domain numbers between these two genotypes. Similar experiments are performed in the in vitro astrocyte acidification, which constituted changing the perfusate from aCSF at pH 7.4, to aCSF at pH 7.2. In G, an example of a PHOX2B‐derived astrocyte is plotted. In H, the percentage of astrocytes showing increased activity in response to acidification is plotted and shows no change between conditions. We also performed global synchronization experiments in JN, and found no significant change in the fold increase in active domains (KL) and no difference in the fold increase in synchronized events between conditions. Representative movies are shown in Videos S1–S10 in Supporting information. [Color figure can be viewed at wileyonlinelibrary.com]
Figure 12
Figure 12. Ultrastructural analysis of RTN axon terminals
Images are delineated by theme on the left‐hand side and by genotype on top. Phagosomes localized to RTN axon terminals were seen to be of two types illustrated in panels AD (black arrow points to phagosome). Some phagosomes were large, membrane‐bound vesicles with electron‐dense material, whereas others were membrane‐bound, electron‐lucent vesicles. PHOX2Bcre, Aldh1l1 loxp‐GFP‐loxp‐DTA showed a propensity to having larger axon terminals than controls (E and F). G, axon terminal phagosome quantification. H, axon terminus area plot. I, axon terminus perimeter plot. Ultrastructural morphology of the ventral lateral surface in control and PHOX2B‐derived astrocyte‐ablated animals shows no change between groups, with intermediate filament rich astrocyte foot processes extending to the pial surface and pial‐arachnoidal fibroblast‐like cells depositing collagen. Abundant dense core neurosecrotory granules were found in axon terminals in both groups (NO, quantified in K). We did not see differences in tripartite synapses (Q and R). In the box plots in panels G, H, I, J and K, continuous lines within the box denote population median, box denotes the interquartile rage, and the whiskers denote 1.5× the interquartile range. The P‐statistic in top left of panels G, H, I, J and K is derived from Student's t test. μ, mean.

References

    1. Agarwal A, Wu PH, Hughes EG, Fukaya M, Tischfield MA, Langseth AJ, Wirtz D & Bergles DE (2017). Transient opening of the mitochondrial permeability transition pore induces microdomain calcium transients in astrocyte processes. Neuron 93, 587–605.e7. - PMC - PubMed
    1. Alam MN, Szymusiak R, Gong H, King J & McGinty D (1999). Adenosinergic modulation of rat basal forebrain neurons during sleep and waking: neuronal recording with microdialysis. J Physio 521, 679–690. - PMC - PubMed
    1. Amiel J, Laudier B, Attie‐Bitach T, Trang H, de Pontual L, Gener B, Trochet D, Etchevers H, Ray P, Simonneau M, Vekemans M, Munnich A, Gaultier C & Lyonnet S (2003). Polyalanine expansion and frameshift mutations of the paired‐like homeobox gene PHOX2B in congenital central hypoventilation syndrome. Nat Genet 33, 459–461. - PubMed
    1. Angelova PR, Kasymov V, Christie I, Sheikhbahaei S, Turovsky E, Marina N, Korsak A, Zwicker J, Teschemacher AG, Ackland GL, Funk GD, Kasparov S, Abramov AY & Gourine AV (2015). Functional oxygen sensitivity of astrocytes. J Neurosci 35, 10460–10473. - PMC - PubMed
    1. Arrigoni E, Rainnie DG, McCarley RW & Greene RW (2001). Adenosine‐mediated presynaptic modulation of glutamatergic transmission in the laterodorsal tegmentum. J Neurosci 21, 1076–1085. - PMC - PubMed

Publication types

LinkOut - more resources