Review
. 2019 Mar;39(1):125-143.
doi: 10.1016/j.cll.2018.10.003. Epub 2018 Dec 22.

MicroRNAs and Transplantation

Affiliations
Review

MicroRNAs and Transplantation

Zahraa Khan et al. Clin Lab Med. 2019 Mar.

Abstract

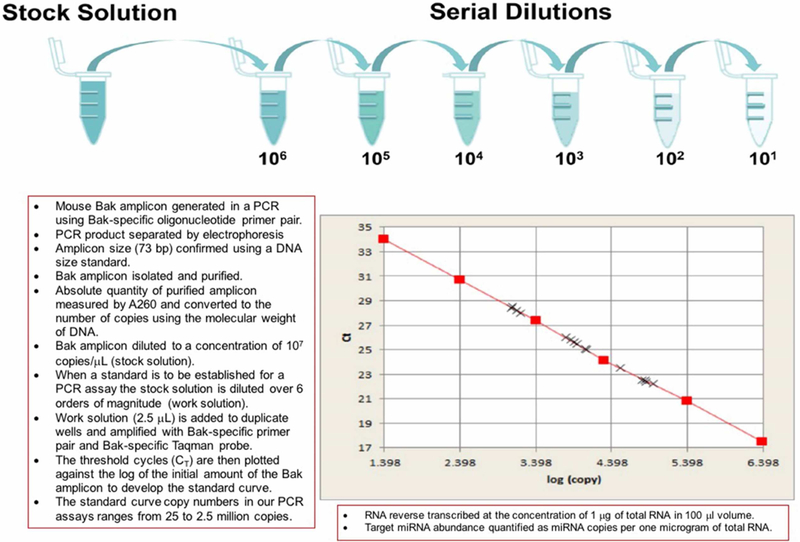
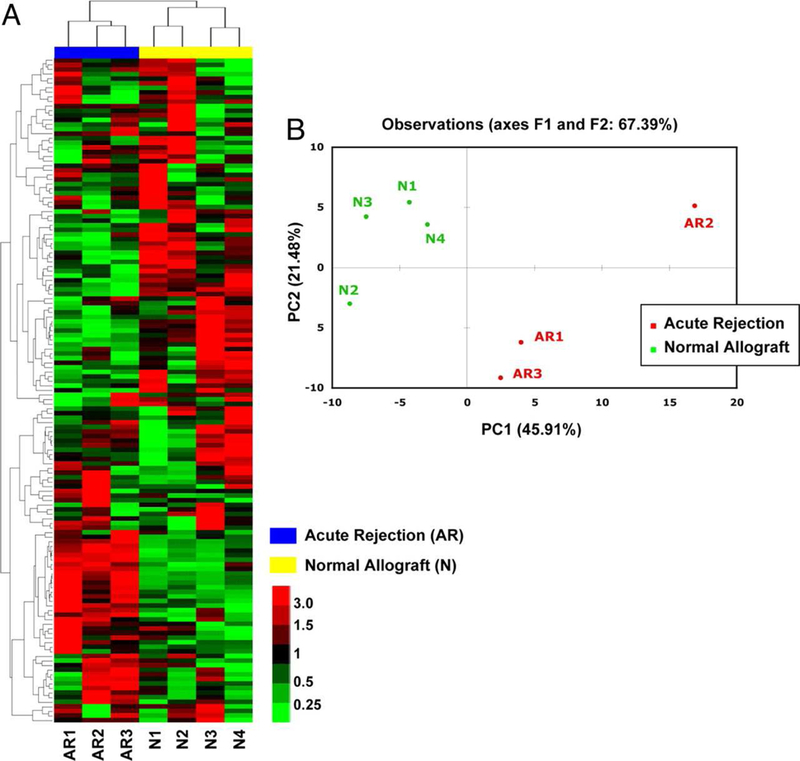
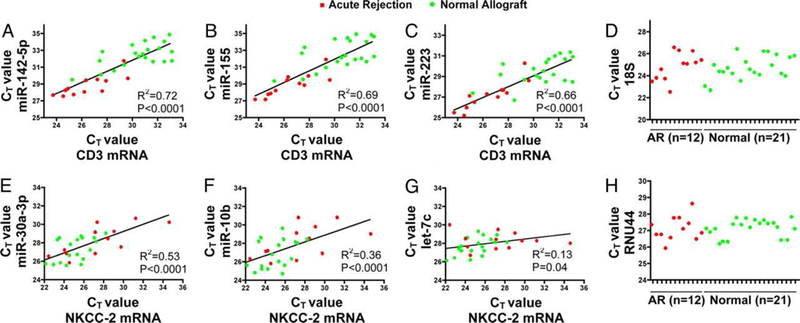
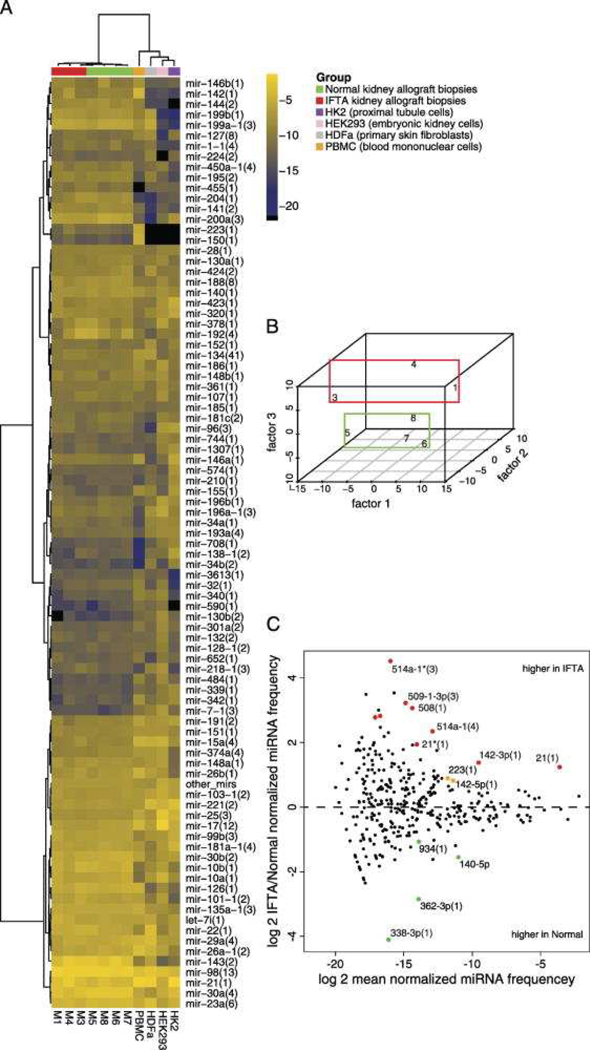
miRNAs, ∼20 to 22 nucleotide single-stranded RNA species that play a pivotal role in the regulation of protein-coding genes, are emerging as robust biomarkers for assessing allograft status. Herein, the authors briefly review the biogenesis and function of the miRNAs and provide an overview of the tools to quantify miRNAs in tissues and body fluids. They then review their studies of discovery and validation of alterations in miRNA expression within kidney allografts with or without acute rejection, as well as with or without fibrosis, and summarize published data on miRNA expression patterns in kidney transplant recipients.

Keywords: Biomarkers; Kidney transplantation; Rejection; miRNA.


Conflict of interest statement

DISCLOSURE STATEMENT

The authors have nothing to disclose.

Figures

Figure 1.
Figure 1.. Development of a Bak amplicon based standard curve for absolute quantification of mRNAs and miRNAs by real time quantitative polymerase chain reaction assay.
A universal standard curve for absolute quantification of mRNAs and miRNAs by quantitative polymerase chain reaction assay was developed in our laboratory by synthesizing and quantifying a customized Bak amplicon template.
Figure 2:
Figure 2:. Clustering analysis of miRNA expression differentiate acute rejection biopsies from normal allograft biopsies of human kidney allografts.
Unsupervised hierarchical clustering (A) and principal component analysis (B) of miRNA expression in 7 human kidney allograft biopsies (3 AR and 4 normal) examined using TLDA. Two major clusters accurately divided the AR biopsies from normal allograft biopsies. Principal component analysis confirmed the separation of AR samples from normal allograft biopsies (From Anglicheau D, Sharma VK, Ding R, et al. MicroRNA expression profiles predictive of human renal allograft status. Proc Natl Acad Sci U S A. 2009;106(13):5331; with permission).
Figure 3.
Figure 3.. Positive association between miRNAs and mRNAs in human kidney allograft biopsies.
The relationship between the intragraft levels of miRNA and mRNA is shown. A strong positive association between the levels of CD3 mRNA and the levels of miRNAs overexpressed in AR biopsies was found: (A) miR-142–5p; (B) miR-155; or (C) miR-223. A positive association between kidney tubule specific NKCC-2 mRNA and miRNAs underexpressed in AR biopsies was also observed: (E) miR-30a-3p; (F) miR-10b; or (G) let-7c. The mean (±SD) CT values of the endogenous control for mRNAs (18S rRNA) (D) and for miRNAs (RNU44 small nucleolar RNA) (H) were similar between the groups (From Anglicheau D, Sharma VK, Ding R, et al. MicroRNA expression profiles predictive of human renal allograft status. Proc Natl Acad Sci U S A. 2009;106(13):5332; with permission).
Figure 4.
Figure 4.. MicroRNA profiles generated by small RNA sequencing distinguish human kidney allograft biopsies with fibrosis from normal allograft biopsies.
This Figure depicts the miRNA profiles generated by small RNA sequencing. A, Hierarchical clustering and heatmap representation of kidney allograft biopsies with fibrosis (IFTA, Interstitial fibrosis and tubular atrophy) and normal allograft biopsies, human peripheral blood mononuclear cells (PBMC), HDFa (primary skin fibroblast), HEK293 cells (human embryonic kidney cells), and HK2 cells (kidney proximal tubule cells) according to merged miRNA profiles. B, Multidimensional scaling showing separation of IFTA biopsies from Normal biopsies. C, MA plot showing the differentially expressed miRNA sequence families. Colored data points represent P<0.05 (red points signify in addition FDR<0.1) (From Ben-Dov IZ, Muthukumar T, Morozov P, et al. MicroRNA sequence profiles of human kidney allografts with or without tubulointerstitial fibrosis. Transplantation. 2012;94(11):1089; with permission).
Figure 5.
Figure 5.. miRNA target identification.
SMAD7 was identified as an miR-21 target by querying a published Argonaute PARCLIP Dataset; aligned and scored by the miRanda algorithm (microrna.org). Colored “t” represents a position found to be crosslinked according to PAR-CLIP T to C transition signature (From Ben-Dov IZ, Muthukumar T, Morozov P, et al. MicroRNA sequence profiles of human kidney allografts with or without tubulointerstitial fibrosis. Transplantation. 2012;94(11):1086–94; with permission).

References

    1. Ha M, Kim VN. Regulation of microRNA biogenesis. Nat Rev Mol Cell Biol 2014;15(8):509–524. - PubMed
    1. Ambros V, Bartel B, Bartel DP, et al. A uniform system for microRNA annotation. RNA 2003;9(3):277–279. - PMC - PubMed
    1. Desvignes T, Batzel P, Berezikov E, et al. miRNA Nomenclature: A View Incorporating Genetic Origins, Biosynthetic Pathways, and Sequence Variants. Trends Genet 2015;31(11):613–626. - PMC - PubMed
    1. Cai X, Hagedorn CH, Cullen BR. Human microRNAs are processed from capped, polyadenylated transcripts that can also function as mRNAs. RNA 2004;10(12):1957–1966. - PMC - PubMed
    1. Yi R, Qin Y, Macara IG, Cullen BR. Exportin-5 mediates the nuclear export of pre-microRNAs and short hairpin RNAs. Genes Dev 2003;17(24):3011–3016. - PMC - PubMed

Publication types