. 2019 Mar 6;101(5):963-976.e7.
doi: 10.1016/j.neuron.2019.01.003. Epub 2019 Jan 29.

Activity Correlations between Direction-Selective Retinal Ganglion Cells Synergistically Enhance Motion Decoding from Complex Visual Scenes

Affiliations

Activity Correlations between Direction-Selective Retinal Ganglion Cells Synergistically Enhance Motion Decoding from Complex Visual Scenes

Norma Krystyna Kühn et al. Neuron. .

Abstract

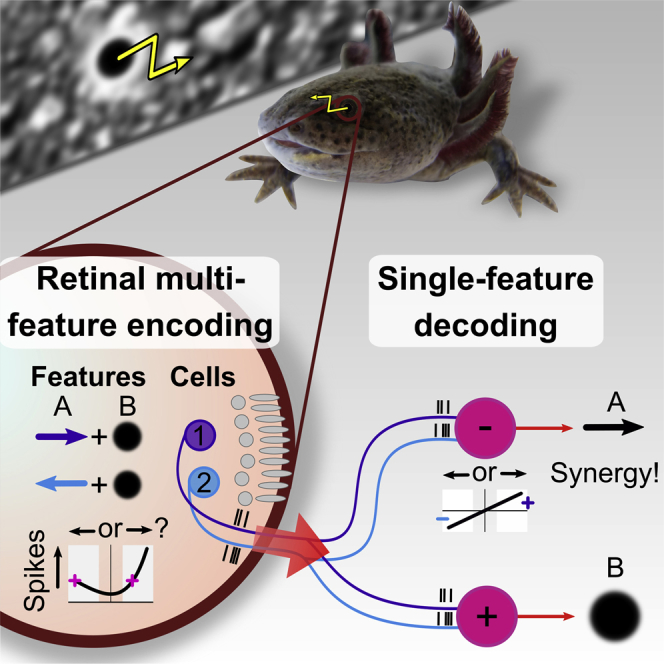
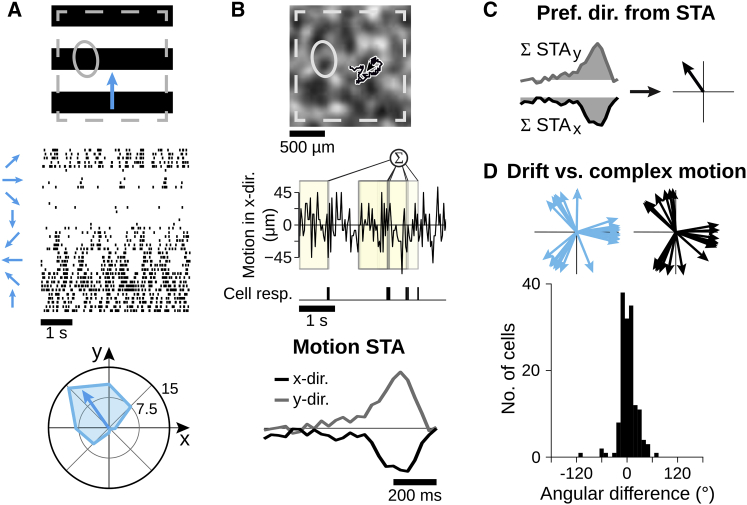
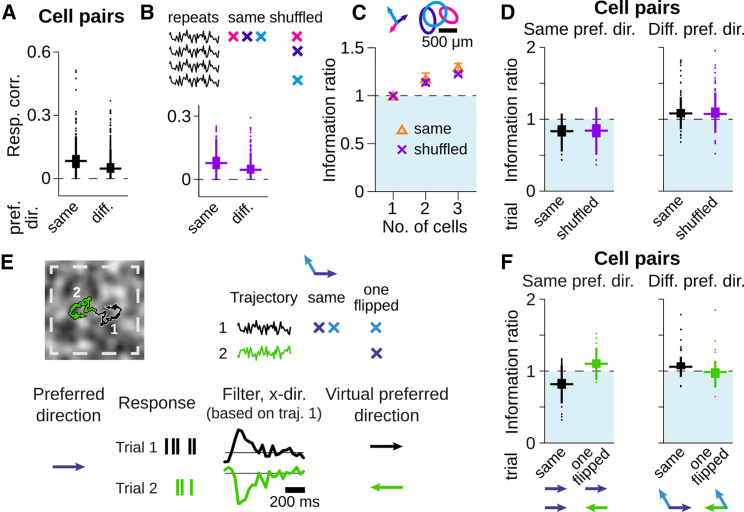
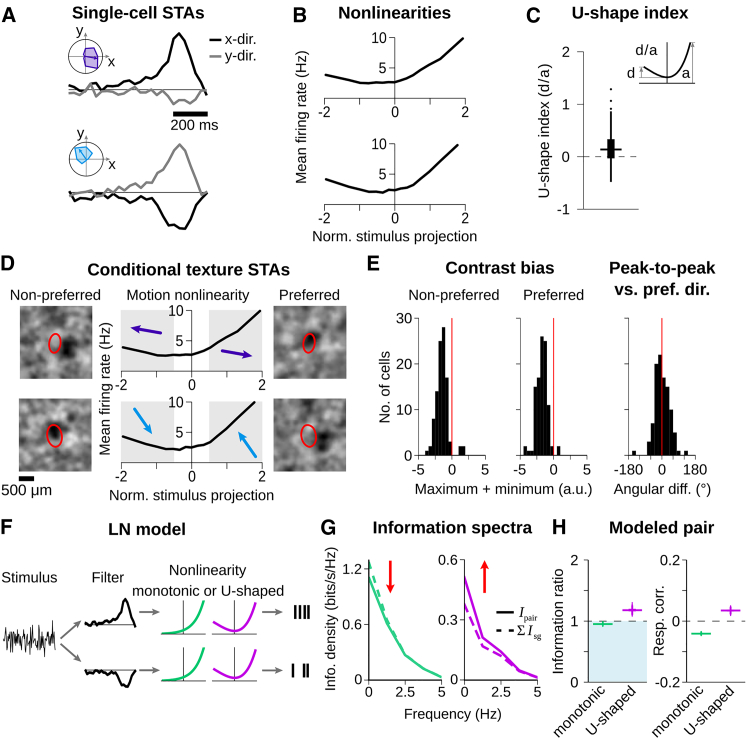
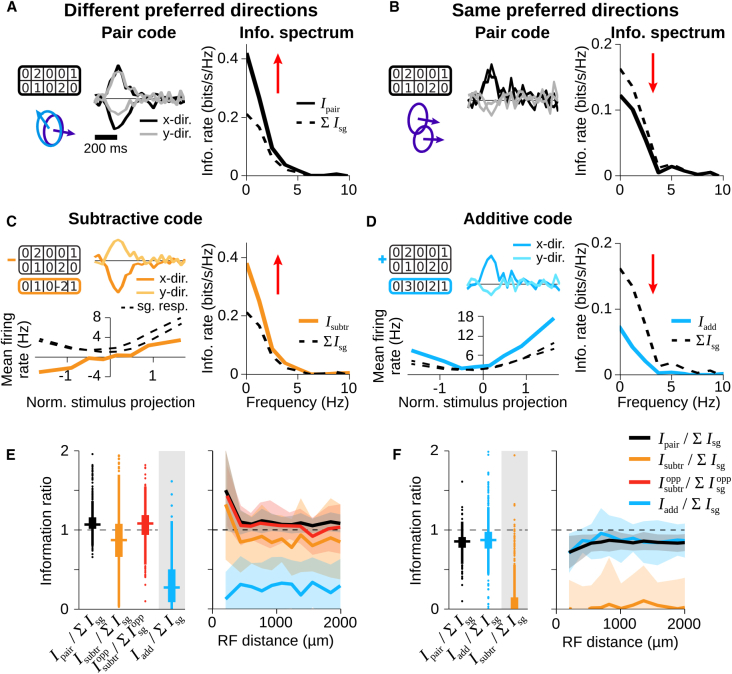
Neurons in sensory systems are often tuned to particular stimulus features. During complex naturalistic stimulation, however, multiple features may simultaneously affect neuronal responses, which complicates the readout of individual features. To investigate feature representation under complex stimulation, we studied how direction-selective ganglion cells in salamander retina respond to texture motion where direction, velocity, and spatial pattern inside the receptive field continuously change. We found that the cells preserve their direction preference under this stimulation, yet their direction encoding becomes ambiguous due to simultaneous activation by luminance changes. The ambiguities can be resolved by considering populations of direction-selective cells with different preferred directions. This gives rise to synergistic motion decoding, yielding more information from the population than the summed information from single-cell responses. Strong positive response correlations between cells with different preferred directions amplify this synergy. Our results show how correlated population activity can enhance feature extraction in complex visual scenes.

Keywords: correlations; direction selectivity; feature extraction; linear decoder; model; population code; retinal ganglion cells; synergy; texture motion; vision.


Figures

None
Graphical abstract
Figure 1
Figure 1
Direction-Selective Ganglion Cells Retain Their Directional Preference under Complex Texture Motion (A) (Top) Applied drifting grating for identifying direction-selective cells (ellipse: receptive field of sample cell; dashed square: recording area). (Middle) Spikes from sample cell for five trials of each of the eight grating directions. (Bottom) Mean firing rates in Hz versus motion direction. Arrow indicates preferred direction of the cell. (B) (Top) Texture for complex motion stimulus with sample trajectory. (Middle) Responses of same cell as in (A) with schematic of spike-triggered average (STA) calculation in x direction. (Bottom) STA in x and y direction. (C) Areas below STA in x and y direction are integrated to determine preferred direction for complex texture motion. (D) (Top) Preferred directions from drifting gratings (blue) and complex texture motion (black) within one sample retina (20 direction-selective cells). (Bottom) Distribution of angular differences from 149 cells with significant motion STAs from 10 retinas is shown. For responses to contrast steps and white-noise stimulation, see Figure S1.
Figure 2
Figure 2
Linear Population Decoding of Random Motion Steps Is Synergistic for Direction-Selective Cells with Different Preferred Directions (A–C) Trajectory reconstruction for a population of 20 simultaneously recorded direction-selective ganglion cells. (A) Filters in x direction (left) used to transform the responses (right) into the stimulus reconstruction in (B). (B) Motion steps in x direction (gray), obtained reconstruction (black), and low-pass-filtered stimulus (red), obtained with a Gaussian kernel of 90 ms SD. (C) Spectrum of mutual information between stimulus trajectory and reconstruction. (D) Mutual information for direction-selective cell populations of different sizes. Information from population responses Ipop (black dots) is compared to the summed information from single-cell reconstructions Isg (gray line). Data show mean and SD (depicted by error bars and shaded area, respectively), obtained over all combinations from the 20 cells in (A)–(C). (E) Mean and SD of information ratios Ipop/Isg for different subpopulations with either same preferred direction (temporal: purple; nasal-dorsal: blue; nasal-ventral: pink) or with preferred directions distributed as equally as possible across the three groups (mixed: orange). (Right) Preferred directions and receptive fields of the cells are shown. For a few cells, no receptive field was obtained. (F) Boxplots of information ratios for cell pairs. Horizontal lines and boxes indicate median and interquartile range (IQR), respectively. Vertical lines extend to data points within 1.5 × IQR, and dots indicate outliers. Data are from 10 retinas, 198 cells, 462 pairs with same and 736 pairs with different preferred directions.
Figure 3
Figure 3
Synergistic Trajectory Readout Is Independent of the Spatial Structure of the Texture (A) Applied artificial and natural textures. From left to right: standard texture, pink-noise texture, and two natural images (“leaves” and “pebbles”) are shown. (B) Population filters in x direction of three direction-selective cells for each of the textures. (C) Information ratios of cell pairs with different preferred directions. Boxes and horizontal lines indicate IQR and median, respectively; values within 1.5 × IQR and outliers beyond are indicated by a vertical line and dots, respectively. (D) Schematic for using filters obtained from different textures for the trajectory readout. For each texture, filters were either obtained from responses under the same texture (“same”) or under the smoothed white-noise texture (“standard”). (E) Obtained information rates for different textures, depending on source of the filters. Data are from one retina, 19 cells, and 94 pairs with different preferred directions.
Figure 4
Figure 4
Synergy and Redundancy Do Not Depend on Noise Correlations and Rely on Relative Directional Preference (A and B) Response correlations between cell pairs with same or different preferred directions. Responses are taken from same (A) or “shuffled” trials (B) of repeated stimulus presentations (see inset). Data are from 6 retinas, 104 cells, 389 pairs with same and 615 pairs with different preferred directions. (C) Information ratios for three sample cells with different preferred directions and nearby receptive fields (top) from same or “shuffled” trials. Mean and SD are from all eligible trial combinations. (D) Information ratios of cell pairs with same (left) or different preferred directions (right) from same (black) or shuffled trials (purple). Data are from 6 retinas, 104 cells, 325 pairs with same and 501 pairs with different preferred directions. (E) Schematic for “flipping” a cell’s preferred direction. Trajectory of second trial (green) was flipped along the x and y axis. Responses of cell pairs were either combined from the same trial (“same”) or from different trials (“one flipped”). (Bottom) Sample responses, filters, and corresponding preferred direction of a rightward-motion-preferring cell are shown. (F) Information ratios of cell pairs with same (left) and different preferred directions (right), with reconstructions obtained from filters and responses to same trials (black) or different trials so that one preferred direction is flipped (green). Data are from one retina, 21 cells, 110 pairs with same and 94 pairs with different preferred directions. Boxplots indicate median (horizontal line) and IQR (box); values within 1.5 × IQR and outliers beyond are indicated by a vertical line and dots, respectively.
Figure 5
Figure 5
Non-monotonic Motion-Response Relations Can Induce Synergy for Cell Pairs with Opposing Directional Preference (A and B) STAs in x and y direction (A) and nonlinearities (B) of two direction-selective cells. Insets show directional tunings to drifting gratings. (C) U-shape index of nonlinearities of the same 149 cells as in Figure 1D. Boxes and horizontal lines indicate IQR and median, respectively; values within 1.5 × IQR and outliers beyond are indicated by a vertical line and dots, respectively. Inset shows schematic of U-shape index calculation. (D) Conditional texture STAs for non-preferred (left) and preferred motion trajectories (right) of same cells as in (A). (E) Histograms of contrast biases of conditional texture STAs for non-preferred (left) and preferred motion trajectories (middle) and of angular differences (right) between the preferred direction of a cell and the vector connecting the negative peaks in the two conditional texture STAs. Data are from 10 retinas and 102 cells. (F) LN model for simulating responses of cell pairs, using one-dimensional stimulus filters from cells in (A) and either monotonic (green) or U-shaped nonlinearities (purple), both obtained from fits to measured nonlinearities that correspond to one-dimensional motion (Figure S2). Spike trains were generated by a Poisson process. (G) Information from pair responses (solid line) was decreased for monotonic nonlinearities (left) and increased for U-shaped nonlinearities (right) compared to summed single-cell information (dashed line), indicating redundancy and synergy, respectively. (H) Boxplots as in (C) of information ratios and response correlations from 1,000 simulation runs. For model of two-dimensional motion, see Figure S2.
Figure 6
Figure 6
Response Correlations in Pairs of Direction-Selective Cells Enhance Synergy and Redundancy in Motion Decoding (A–C) Relations between response correlation and receptive field distance (A), between information ratio and response correlation (B), as well as between information ratio and receptive field distance (C) for cell pairs with different (black) or same preferred directions (gray). (D–G) Influence of local stimulus structure on population decoding. (D) Schematic of “offset shuffling.” Information ratios and response correlations were either obtained from cell responses within the same trial (same) or different trials with different offsets (“offset shuffled”). (E and F) Examples of mean information ratios and SDs obtained over all trial combinations of three direction-selective cells with different preferred directions with nearby (E) or distant receptive fields (F). (G) Same as (A)–(C) but from offset shuffled trials. Data points represent mean over all trial combinations. Data are from 5 retinas, 92 cells, 315 pairs with same and 407 pairs with different preferred directions.
Figure 7
Figure 7
Motion-Related Responses of Cell Pairs with Different Preferred Directions Are Anti-correlated (A and B) Canonical correlation analysis (CCA) of responses from sample pairs with different (A) or same preferred directions (B). (Top) Correlation coefficients of CCA (left) and cell properties (right) are shown. (Below) First five CCA stimulus components (left), their projection onto x-y plane (middle, red arrows indicate first motion step), and corresponding response components (right, colors indicate cells above) are shown. (C) Boxplots of correlation coefficients of first five response components of all pairs with different (top) or same preferred directions (bottom). Boxes and horizontal lines indicate IQR and median, respectively; values within 1.5 × IQR and outliers beyond are indicated by a vertical line and dots, respectively. (D) Correlation coefficients of first response component in relation to information ratios of pairs with different (black) or same preferred direction (gray). Data are from 10 retinas, 198 cells, 462 pairs with same and 736 pairs with different preferred directions.
Figure 8
Figure 8
Subtractive Code of Cell Pairs with Different Preferred Directions Captures Synergy (A and B) Population codes for sample pairs with different (A) or same preferred directions (B). (Left) Receptive fields, preferred directions, and pair filters are shown. (Right) Information spectrum of the population code (solid line) compared to the summed single-cell information spectra (dashed) is shown. (C) Subtractive code of cells in (A). Response filter and nonlinearity (left) as well as information spectrum (right) of subtractive code (orange), together with nonlinearities and summed information from single-cell responses (dashed) are shown. (D) Same as (C) but for summed responses (blue) of cells in (B). (E and F) Information ratios as boxplots (left; horizontal line: median, box: IQR, vertical line: values within 1.5 x IQR, dots: outliers beyond 1.5 × IQR) and binned by receptive field distance (right; thick line indicating mean; shaded region SD) from pair responses (black); subtractive code (orange); subtractive code along either x or y direction, depending on which showed greater motion opponency (red); and additive code (blue) for cell pairs with different (E) or same preferred directions (F). Data are from same pairs as in Figures 7C and 7D.

References

    1. Astakhova L., Firsov M., Govardovskii V. Activation and quenching of the phototransduction cascade in retinal cones as inferred from electrophysiology and mathematical modeling. Mol. Vis. 2015;21:244–263. - PMC - PubMed
    1. Averbeck B.B., Latham P.E., Pouget A. Neural correlations, population coding and computation. Nat. Rev. Neurosci. 2006;7:358–366. - PubMed
    1. Barlow H.B., Hill R.M. Selective sensitivity to direction of movement in ganglion cells of the rabbit retina. Science. 1963;139:412–414. - PubMed
    1. Barlow H.B., Hill R.M., Levick W.R. Retinal ganglion cells responding selectively to direction and speed of image motion in the rabbit. J. Physiol. 1964;173:377–407. - PMC - PubMed
    1. Behnia R., Clark D.A., Carter A.G., Clandinin T.R., Desplan C. Processing properties of ON and OFF pathways for Drosophila motion detection. Nature. 2014;512:427–430. - PMC - PubMed

Publication types

LinkOut - more resources