. 2019 Feb 19;50(2):520-532.e3.
doi: 10.1016/j.immuni.2018.12.017. Epub 2019 Jan 29.

An Antigenic Atlas of HIV-1 Escape from Broadly Neutralizing Antibodies Distinguishes Functional and Structural Epitopes

Affiliations

An Antigenic Atlas of HIV-1 Escape from Broadly Neutralizing Antibodies Distinguishes Functional and Structural Epitopes

Adam S Dingens et al. Immunity. .

Abstract

Anti-HIV broadly neutralizing antibodies (bnAbs) have revealed vaccine targets on the virus's envelope (Env) protein and are themselves promising immunotherapies. The efficacy of bnAb-based therapies and vaccines depends in part on how readily the virus can escape neutralization. Although structural studies can define contacts between bnAbs and Env, only functional studies can define mutations that confer escape. Here, we mapped how all possible single amino acid mutations in Env affect neutralization of HIV by nine bnAbs targeting five epitopes. For most bnAbs, mutations at only a small fraction of structurally defined contact sites mediated escape, and most escape occurred at sites near, but not in direct contact with, the antibody. The Env mutations selected by two pooled bnAbs were similar to those expected from the combination of the bnAbs's independent action. Overall, our mutation-level antigenic atlas provides a comprehensive dataset for understanding viral immune escape and refining therapies and vaccines.

Keywords: BG505; antibody immunotherapy; deep mutational scanning; immune escape; mutational antigenic profiling; virus evolution.


Conflict of interest statement

Competing interests

The authors have no competing interests.

Figures

Figure 1
Figure 1. Schematic of mutational antigenic profiling of a panel of bnAbs.
A. The bnAb panel. Breadth measures are from the 100 most commonly used viruses on LANL’s CATNAP (Yoon et al., 2015). B. For each epitope, structurally defined antibody contact sites are indicated by colors on the side and top view of the BG505 SOSIP Env trimer (PDB:5FYL). C. The mutational antigenic profiling experimental workflow, and example data from bnAb 10E8. A mutant virus library is incubated with or without and antibody before infecting SupT1.CCR5 cells. Non-integrated viral cDNA from infected cells is deep sequenced to quantify the frequency of each env mutation in both the antibody-selected and mock-selected conditions, and the overall fraction of the virus library that survives antibody neutralization is quantified via qPCR. The fraction of each mutant that survives neutralization is plotted at the site level in line plots, and at the mutation level in logoplots. The height of each letter is proportional the fraction of the virions with that amino acid that survived antibody selection in excess of the overall library average.
Figure 2
Figure 2. Env-wide escape profiles distinguish functional from structural antibody epitopes.
A. The line plots show the excess fraction surviving antibody neutralization averaged across all mutations at each site. Structurally defined contact sites are indicated by a blue line. The structures show the BG505 Env SOSIP trimer (PDB:5FYL) with sites of significant escape colored yellow, contact sites colored blue, and overlap between these sets of sites colored green. For 10E8, the MPER peptide structure (which is absent from the SOSIP trimer) is also shown (PDB:4G6F). B. Bars give the number of structurally defined contact sites for each antibody, with green indicating the contact sites that are also sites of significant escape. C. Bars give the number of sites of significant escape for each antibody, with green indicating the sites of escape that are also contact sites. The green bars encompass the same sets of sites in panels B and C. Median values across all biological replicates were plotted; see Figure S1 for the number of experimental replicates. See also Figures S2, S3.
Figure 3
Figure 3. Escape From V3 glycan supersite and V2 apex bnAbs.
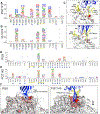
A, B. Escape profiles for V3 glycan supersite bnAbs PGT121 and 10–1074. Letter heights indicate the excess fraction surviving for each mutation. Blue circles indicate structurally defined contact sites, and yellow underlines indicate a N-linked glycosylation motif. Logoplots that show escape across Env are in Data S1. C. V3 glycan supersite antibodies are shown in blue, and Env is colored according to the maximum excess fraction surviving at each site. Note that for PGT121, the closely related clonal variant PGT122 structure is used in lieu of a PGT121 structure (PDBs: 5FYL and 5T3Z respectively). D, E. Escape profiles of V2 glycan/apex antibodies PG9 and PGT145, presented in the same manner as A, B. F. V2 glycan/apex antibodies are shown in blue, and Env is colored according to the maximum excess fraction surviving at each site (PDBs: 5VJ6 and 5V8L respectively). Median values across all biological replicates were plotted; see Figure S1 for the number of experimental replicates. See also Figures S2, S3, and S3.
Figure 4
Figure 4. Escape from CD4bs bnAbs.
A,B. Escape profiles for CD4bs bnAbs VRC01 and 3BNC117. Letter heights indicate the excess fraction surviving for each mutation. Blue circles indicate structurally defined contact sites, and yellow underlines indicate a N-linked glycosylation motif. Portions of the canonical CD4bs epitope are underlined in black and labeled. Logoplots that show escape across Env are in Data S1. C. Antibodies are shown in blue, and Env is colored according to the average fraction surviving at each site (PDBs: 5FYK and 5V8M respectively). Median values across all biological replicates were plotted; see Figure S1 for the number of experimental replicates. See also Figures S2, S3.
Figure 5
Figure 5. Escape from fusion peptide/interface and MPER bnAbs.
A, B. Escape profiles for fusion peptide and gp120/gp41 interface bnAbs VRC34.01 and PGT151. Letter heights indicate the excess fraction surviving for each mutation. Logoplots that show escape across Env are in Data S1. C. Fusion peptide antibodies are shown in blue, and Env is colored according to the maximum excess fraction surviving at each site (PDBs: 5I8H and 5FUU respectively). D. Escape profile for MPER bnAb 10E8, presented in the same manner as A, B. E. 10E8 is shown in blue, and the MPER peptide is colored according to the maximum excess fraction surviving at each site (PDB 4G6F). Median values across all biological replicates were plotted; see Figure S1 for the number of experimental replicates. See also Figures S2, S3.
Figure 6
Figure 6. Escape from a 3BNC117 and 10–1074 pooled bnAbs.
A. The excess fraction surviving neutralization averaged across all mutations at each site. Data from Figure 3 (10–1074) and Figure 4 (3BNC117) are re-plotted for relevant sites. For the pooled 3BNC117 and 10–1074 data, the mean value across six replicates is plotted. The simulated data is the product of each antibody’s mean excess mutation fraction surviving values. B. A logoplot zooming in on epitope regions for each dataset. In A and B, the simulated data is distinguished from the experimental data with a light grey overlay. See also Figure S1.
Figure 7
Figure 7. Quantifying the ability to escape each bnAb.
A. The excess fraction surviving for the 100 largest effect mutations for each antibody. Closed circles indicate mutations that are one nucleotide mutation away from BG505 wildtype, while open circles indicate mutations that are 2 or 3 nucleotide mutations away from BG505 wildtype sequence. B. Each antibody’s breadth (as quantified in Figure 1) is plotted against the sum of the excess mutation fraction surviving values at all significant sites of viral escape.

Comment in

  • Playing Chess with HIV.
    Ward AB. Ward AB. Immunity. 2019 Feb 19;50(2):283-285. doi: 10.1016/j.immuni.2019.01.011. Immunity. 2019. PMID: 30784575

Similar articles

Cited by

References

    1. Adams RM, Kinney JB, Walczak AM, and Mora T (2017). Physical epistatic landscape of antibody binding affinity 1–15.
    1. Back NK, Smit L, Schutten M, Nara PL, Tersmette M, and Goudsmit J (1993). Mutations in human immunodeficiency virus type 1 gp41 affect sensitivity to neutralization by gp120 antibodies. J. Virol 67, 6897–6902. - PMC - PubMed
    1. Bar-On Y, Gruell H, Schoofs T, Pai JA, Nogueira L, Butler AL, Millard K, Lehmann C, Suárez I, Oliveira TY, et al. (2018). Safety and antiviral activity of combination HIV-1 broadly neutralizing antibodies in viremic individuals. Nat. Med - PMC - PubMed
    1. Bar KJ, Sneller MC, Harrison LJ, Justement JS, Overton ET, Petrone ME, Salantes DB, Seamon C. a., Scheinfeld B, Kwan RW, et al. (2016). Effect of HIV Antibody VRC01 on Viral Rebound after Treatment Interruption. N. Engl. J. Med. NEJMoa 1608243. - PMC - PubMed
    1. Barton JP, Goonetilleke N, Butler TC, Walker BD, McMichael AJ, and Chakraborty AK (2016). Relative rate and location of intra-host HIV evolution to evade cellular immunity are predictable. Nat. Commun 7, 1–10. - PMC - PubMed

Publication types

MeSH terms