. 2019 Apr;29(4):613-625.
doi: 10.1101/gr.246710.118. Epub 2019 Feb 1.

Chromatin architecture reorganization during neuronal cell differentiation in Drosophila genome

Affiliations

Chromatin architecture reorganization during neuronal cell differentiation in Drosophila genome

Keerthi T Chathoth et al. Genome Res. 2019 Apr.

Abstract

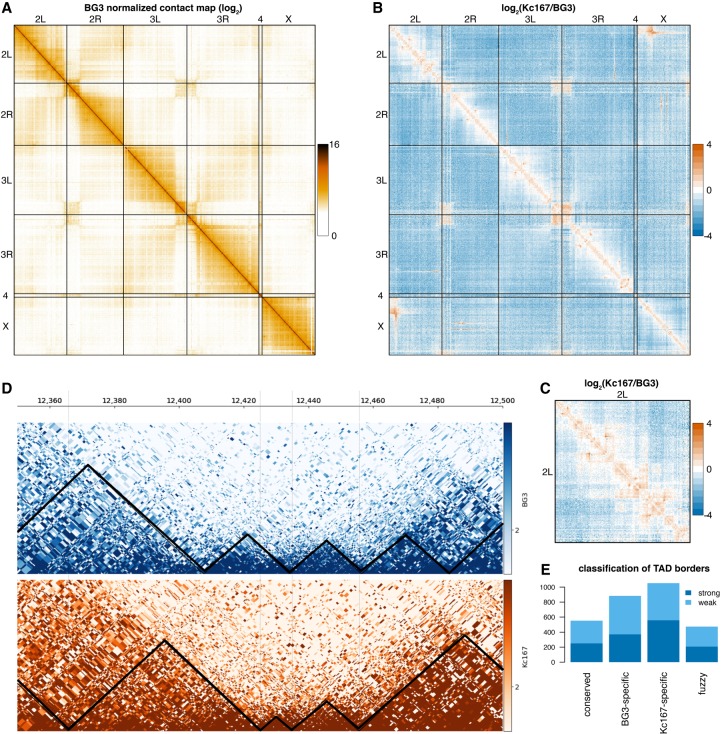
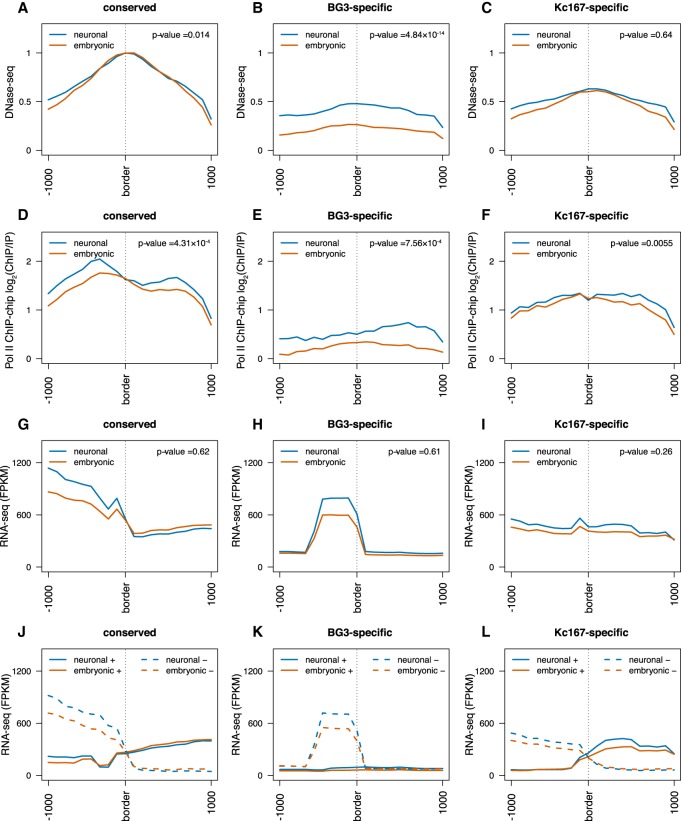
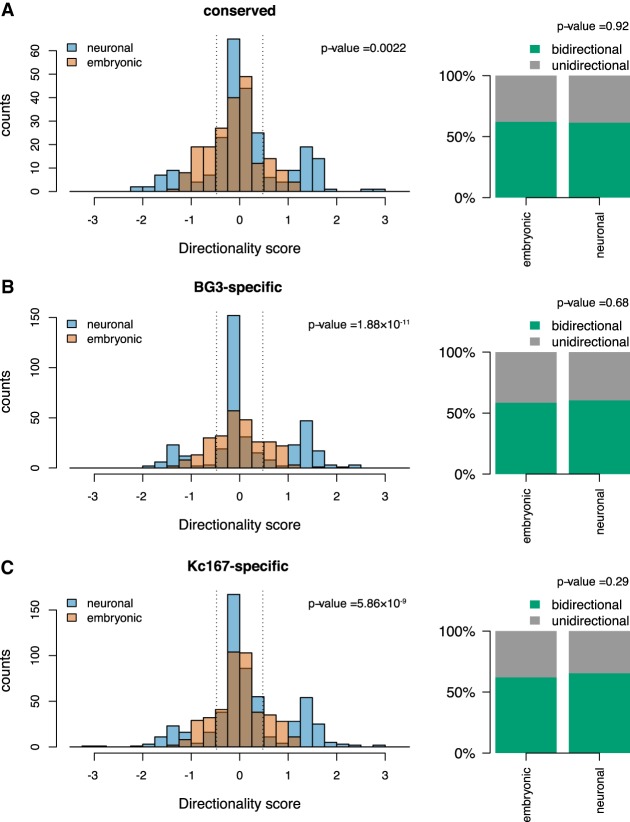
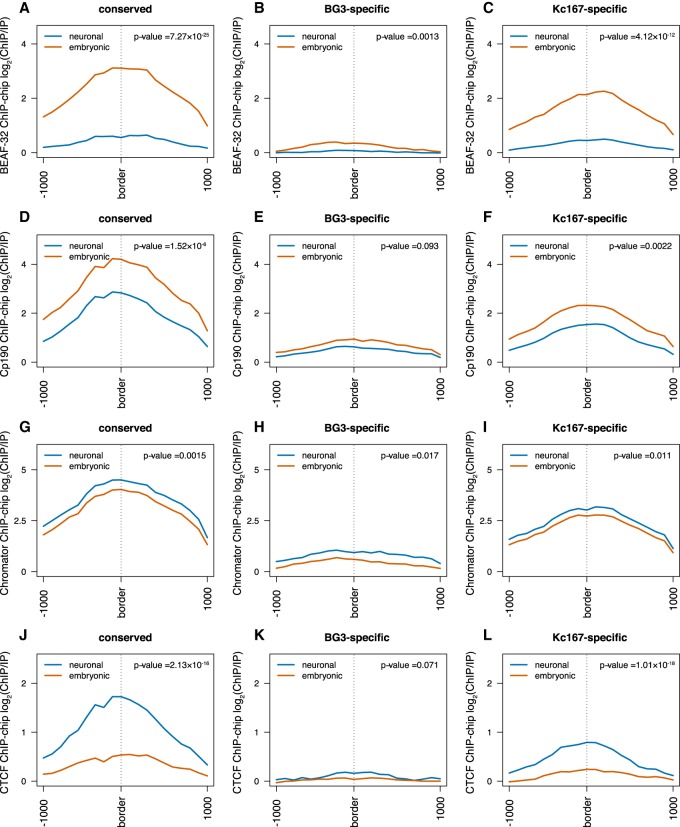
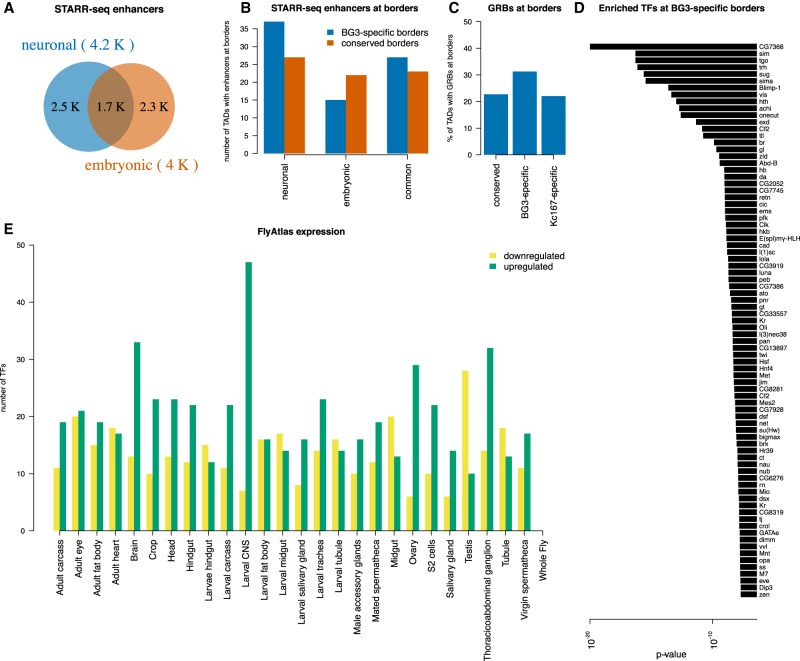
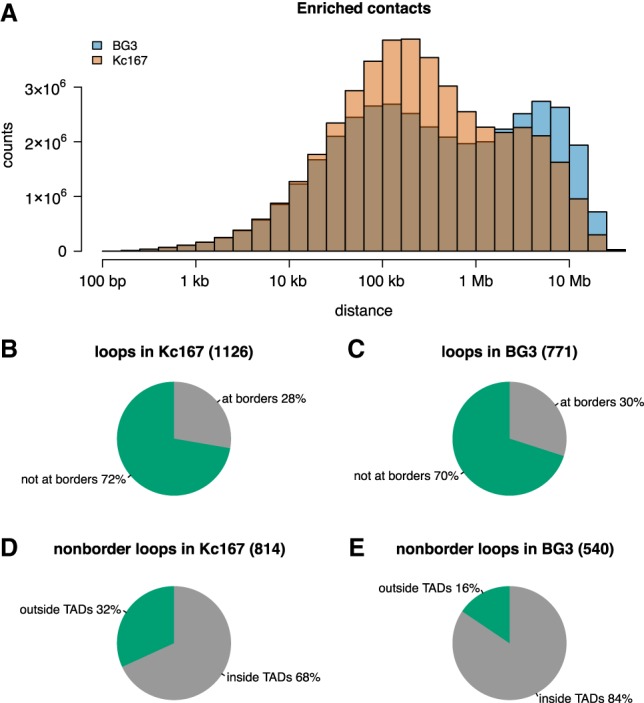
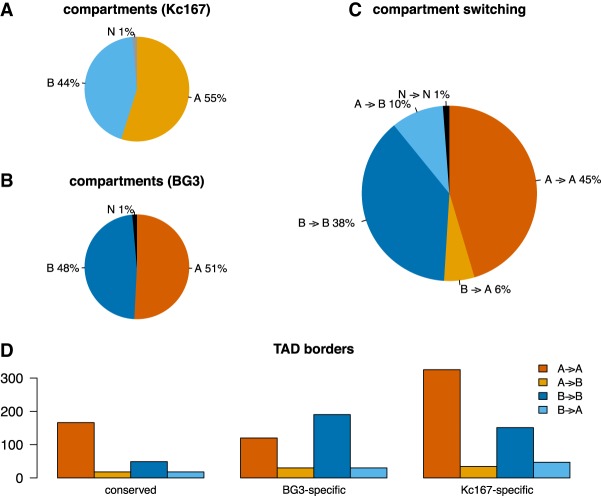
The organization of the genome into topologically associating domains (TADs) was shown to have a regulatory role in development and cellular function, but the mechanism involved in TAD establishment is still unclear. Here, we present the first high-resolution contact map of Drosophila neuronal cells (BG3) and identify different classes of TADs by comparing this to genome organization in embryonic cells (Kc167). We find that only some TADs are conserved in both cell lines, whereas the rest are cell-type-specific. This is supported by a change in the enrichment of architectural proteins at TAD borders, with BEAF-32 present in embryonic cells and CTCF in neuronal cells. Furthermore, we observe strong divergent transcription, together with RNA Polymerase II occupancy and an increase in DNA accessibility at the TAD borders. TAD borders that are specific to neuronal cells are enriched in enhancers controlled by neuronal-specific transcription factors. Our results suggest that TADs are dynamic across developmental stages and reflect the interplay between insulators, transcriptional states, and enhancer activities.


Figures

Figure 1.
Figure 1.
A high-resolution contact map of Drosophila BG3 cells. (A) Genome-wide normalized contact map of the Drosophila BG3 cell line at 100-kb resolution. Each element in the matrix represents the log2 of the normalized number of contacts between the two corresponding bins. (B) The log2 ratio between the normalized number of contacts in BG3 cells and Kc167 cells as indicated. (C) The log2 ratio between the normalized number of contacts in BG3 cells and Kc167 cells on Chromosome 2L. (D) Triangle view of the normalized contact map in BG3 cells at 2L:12,350,000–12,500,000 locus. Black lines demarcate the TADs. (E) Classification of TAD borders in BG3 cells as described in the main text: conserved borders, BG3-specific borders, Kc167-specific borders, and fuzzy borders. Depending on whether the TAD borders can still be detected when increasing the stringency of the TAD calling algorithm, we split each class of TAD border into two subgroups: strong borders and weak borders.
Figure 2.
Figure 2.
Divergent transcription and polymerase occupancy correlates with appearance of TAD borders. (A–C) DNase-seq signal at three different TAD border classes (conserved, BG3-specific, and Kc167-specific) as indicated. The red line represents data from embryonic cells (Kc167); the blue, from neuronal-derived cells (BG3). Average profile has been plotted considering 1 kb around each border. We performed a nonparametric Mann–Whitney U test considering the highest levels at each TAD border between embryonic and neuronal cells (see P-values). (D–F) Average Pol II ChIP-chip signal (log2 ChIP/input) at the borders of the three different TAD classes as indicated. (G–I) Average RNA-seq levels at the borders of the three different TAD classes as indicated. (J–L) Strand-specific average RNA-seq signal at the borders of the three different TAD classes showing strong divergent transcription at TAD borders. Solid lines represent the expression levels on the positive strand; dashed lines, the expression levels on the negative strand. For that, we mapped the expression levels of the genes to the corresponding strand using the FlyBase annotation (see Methods) (dos Santos et al. 2015).
Figure 3.
Figure 3.
Bidirectional transcription at TAD borders. Histograms representing the directionality score computed as log10 of the ratio between nascent RNA levels in 500 bp on the positive strand downstream from the border and on the negative strand upstream of the border; 500-bp bins that were 500 bp away were considered in both directions from the border. The barplot represents the percentage of TAD borders in which the directionality score was lower than 0.47 (dotted lines on the histogram, representing less than three times more transcription on one strand). We classified these borders as bidirectional borders. We used a Kolmogorov–Smirnov test to compare the change in distribution of bidirectionality score (see P-values) and a Fisher's exact test to compare if the change in number of bidirectional TAD borders is statistically significant (see P-values). (A) Conserved TAD borders; (B) BG3-specific TAD borders; and (C) Kc167-specific TAD borders.
Figure 4.
Figure 4.
Architectural proteins differentially occupy TAD borders in a cell-type–specific manner. (A–C) Average BEAF-32 ChIP-chip signal (log2 ChIP/input) at three different TAD border classes (conserved, BG3-specific, and Kc167-specific). The red line represents data from embryonic cells; the blue, from neuronal-derived cells. As before, 1 kb around each border was considered while plotting the average profile. We performed a nonparametric Mann–Whitney U test considering the highest levels at each TAD border between embryonic and neuronal cells (see P-values). (D–F) Average Cp190 ChIP-chip signal (log2 ChIP/input) at the borders of the three different TAD classes. (G–I) Average Chromator ChIP-chip signal (log2 ChIP/input) at the borders of the three different TAD classes. (J–L) Average CTCF ChIP-chip signal (log2 ChIP/input) at the borders of the three different TAD classes.
Figure 5.
Figure 5.
Cell-type–specific enhancers correlate with cell-type–specific TAD borders. (A) Venn diagram representing the number of enhancers in neuronal and embryonic Drosophila cells as identified by STARR-seq. Enhancers were classified as cell specific if they were annotated only in one cell type or as common if they were annotated in both cell types. (B) The number of conserved (red) or BG3-specific (blue) TAD borders that overlap with a cell-type–specific or common enhancer. Barplot showing more BG3-specific borders with neuronal enhancers than with common or embryonic enhancers, unlike conserved TAD borders. (C) The percentage of TAD borders that overlap with gene regulatory blocks (GRBs) (Harmston et al. 2017). A higher number of BG3-specific borders overlap with GRBs compared with conserved borders (Fisher's exact test P-value = 0.022) or Kc167-specific borders (Fisher's exact test P-value = 0.0021), but there is no difference between conserved borders and Kc167-specific borders (Fisher's exact test P-value = 0.86). (D) List of 81 TFs with enriched motifs at BG3-specific borders and the associated P-value (see Methods). (E) Expression of 79 of these TFs in different tissues/cells from FlyAtlas data set. Green represents up-regulated genes; yellow, down-regulated genes as indicated.
Figure 6.
Figure 6.
BG3 cells display more long-range interactions compared with Kc167 cells. (A) Histogram showing the distances between two anchors of enriched contacts in the contact matrices (for BG3 and Kc167 cells). To keep consistency, we considered the down-sampled Kc167 Hi-C map, which had the same number of interactions as the BG3 map. (B,C) Distribution of chromatin loops at the borders of TADs in Kc167 and BG3 cells, showing that both cells have similar number of loops at TAD borders (Fisher's exact test P-value = 0.3). (D,E) Distribution of nonborder chromatin loops within TADs or between TADs in Kc167 and BG3 cells, showing that Kc167 cells display more loops within TADs compared with BG3 cells (Fisher's exact test P-value = 6.61 × 10⁻¹²).
Figure 7.
Figure 7.
A/B compartments in Kc167 and BG3 cells. (A,B) Percentage of the genome that was computed as either an A or a B compartment (Lieberman-Aiden et al. 2009). Regions that could not be classified as either an A or a B compartment were labeled as N. (C) The percentage of A/B compartments that switched after differentiation from embryonic to neuronal cells. (D) TAD borders location within the A/B compartments.

Similar articles

Cited by

References

    1. Adams MD, Celniker SE, Holt RA, Evans CA, Gocayne JD, Amanatides PG, Scherer SE, Li PW, Hoskins RA, Galle RF, et al. 2000. The genome sequence of Drosophila melanogaster. Science 287: 2185–2195. 10.1126/science.287.5461.2185 - DOI - PubMed
    1. Arnold CD, Gerlach D, Stelzer C, Boryń ŁM, Rath M, Stark A. 2013. Genome-wide quantitative enhancer activity maps identified by STARR-seq. Science 339: 1074–1077. 10.1126/science.1232542 - DOI - PubMed
    1. Benedetti F, Racko D, Dorier J, Burnier Y, Stasiak A. 2017. Transcription-induced supercoiling explains formation of self-interacting chromatin domains in S. pombe. Nucleic Acids Res 45: 9850–9859. 10.1093/nar/gkx716 - DOI - PMC - PubMed
    1. Bonev B, Cavalli G. 2016. Organization and function of the 3D genome. Nat Rev Genet 17: 661–678. 10.1038/nrg.2016.112 - DOI - PubMed
    1. Bonev B, Cohen NM, Szabo Q, Fritsch L, Papadopoulos GL, Lubling Y, Xu X, Lv X, Hugnot JP, Tanay A, et al. 2017. Multiscale 3D genome rewiring during mouse neural development. Cell 171: 557–572.e24. 10.1016/j.cell.2017.09.043 - DOI - PMC - PubMed

Publication types