

Effects of roads on giant panda distribution: a mountain range scale evaluation
- PMID: 30710093
- PMCID: PMC6358623
- DOI: 10.1038/s41598-018-37447-0
Effects of roads on giant panda distribution: a mountain range scale evaluation
Abstract
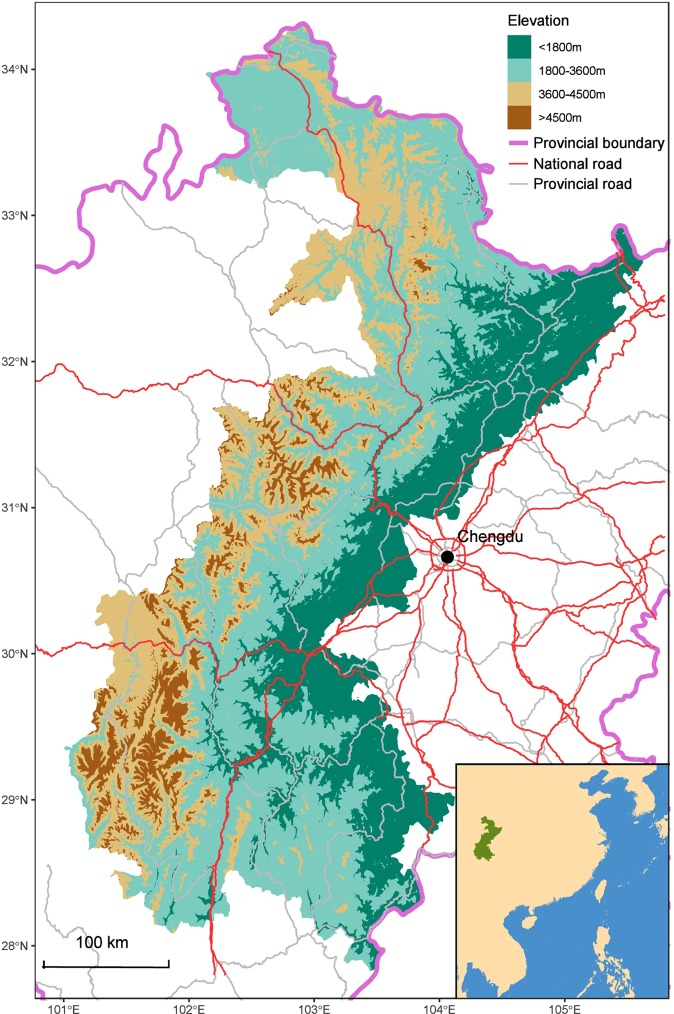
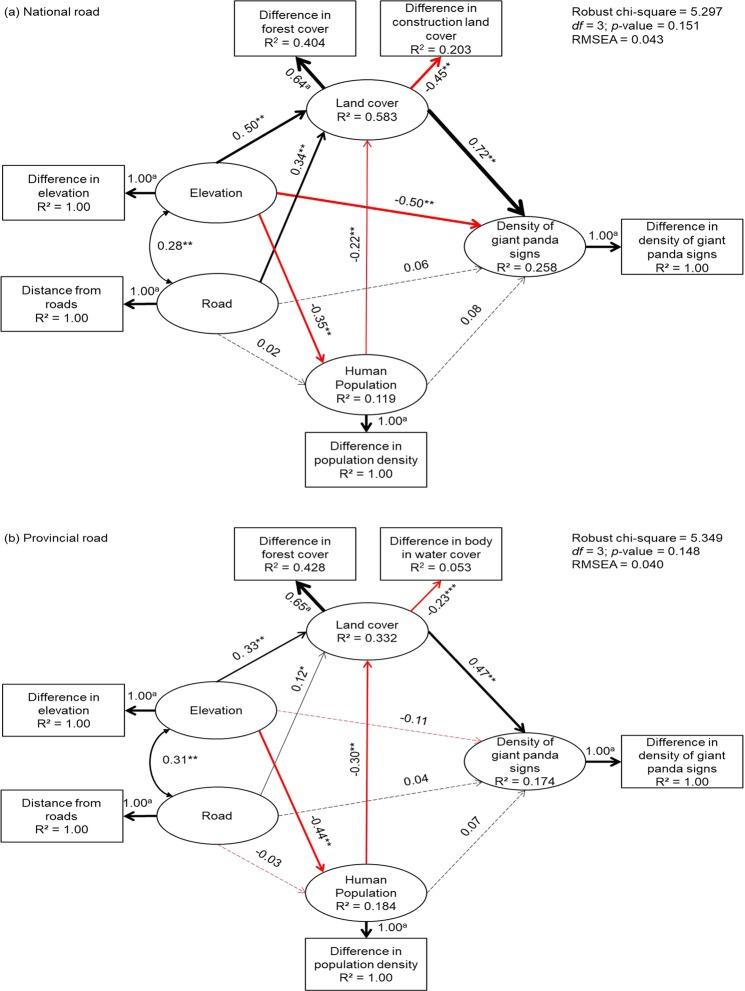
Few studies have focused on the mountain ranges scale effects of roads on wildlife. This lack of data could lead to an underestimation of the negative impact of roads on animal populations. We analyzed a dataset that included 74.4% of the giant panda population and covered 78.7% of the global giant panda habitat to estimate road-effect zones for major roads, and to investigate how these major roads influenced the distribution of giant pandas on a mountain range spatial scale. We found that the density of giant panda signs was significantly decreased by proximity to major roads. The effect zone reached 5,000 m from national roads and 1,500 m from provincial roads. Structural equation model analysis revealed that the strongest negative impact of major roads on giant pandas was via the reduction of nearby forest cover. The results should provide a better understanding of the impact of anthropogenic infrastructure and regional economic development on wildlife, thus providing a basis for conservation policy decisions. We suggest that the environmental impact assessment of proposed roadways or further researches on road ecological effects should expand to a larger scale and consider the possible habitat degradation caused by road access.
Conflict of interest statement
The authors declare no competing interests.
Figures


References
-
- Forman RTT, Alexander LE. Roads and their major ecological effects. Annu Rev Ecol Syst. 1998;29:207–231. doi: 10.1146/annurev.ecolsys.29.1.207. - DOI
-
- Fahrig L, Rytwinski T. Effects of roads on animal abundance: an empirical review and synthesis. Ecol Soc. 2009;14:124–124. doi: 10.5751/ES-02815-140121. - DOI
-
- Spellerberg IF. Ecological effects of roads and traffic: a literature review. Global Ecol Biogeogr. 1998;7:317–333. doi: 10.1046/j.1466-822x.1998.00308.x. - DOI
-
- Gu HJ, Dai Q, Wang Q, Wang YZ. Factors contributing to amphibian road mortality in a wetland. Curr Zool. 2011;57:768–774. doi: 10.1093/czoolo/57.6.768. - DOI
Publication types
MeSH terms
LinkOut - more resources
Full Text Sources
