. 2019 Mar;14(3):756-780.
doi: 10.1038/s41596-018-0113-7. Epub 2019 Feb 1.

Integrative analysis of pooled CRISPR genetic screens using MAGeCKFlute

Affiliations

Integrative analysis of pooled CRISPR genetic screens using MAGeCKFlute

Binbin Wang et al. Nat Protoc. 2019 Mar.

Abstract

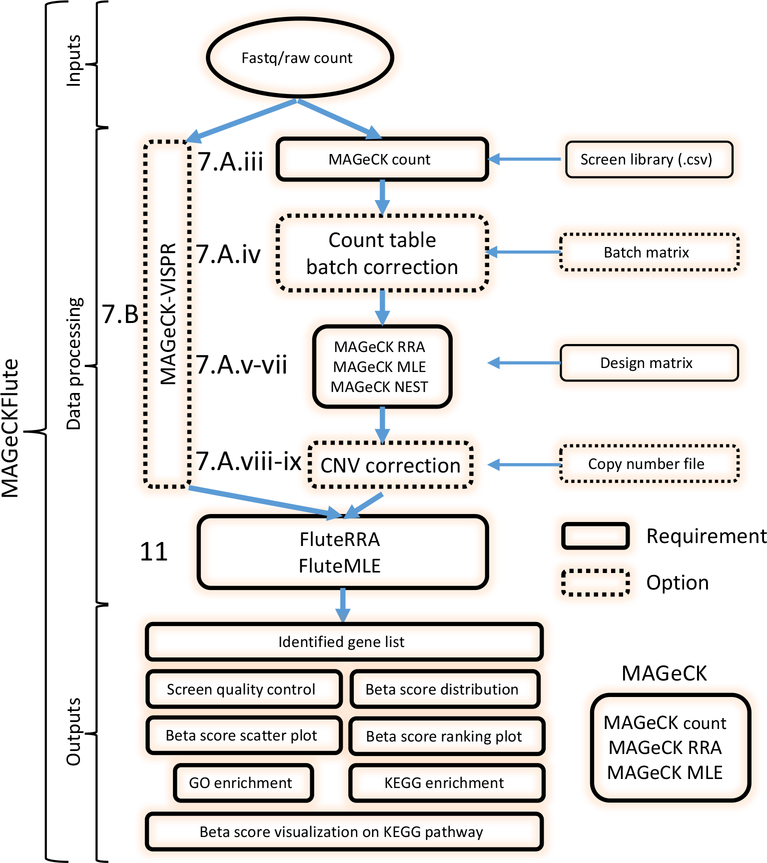
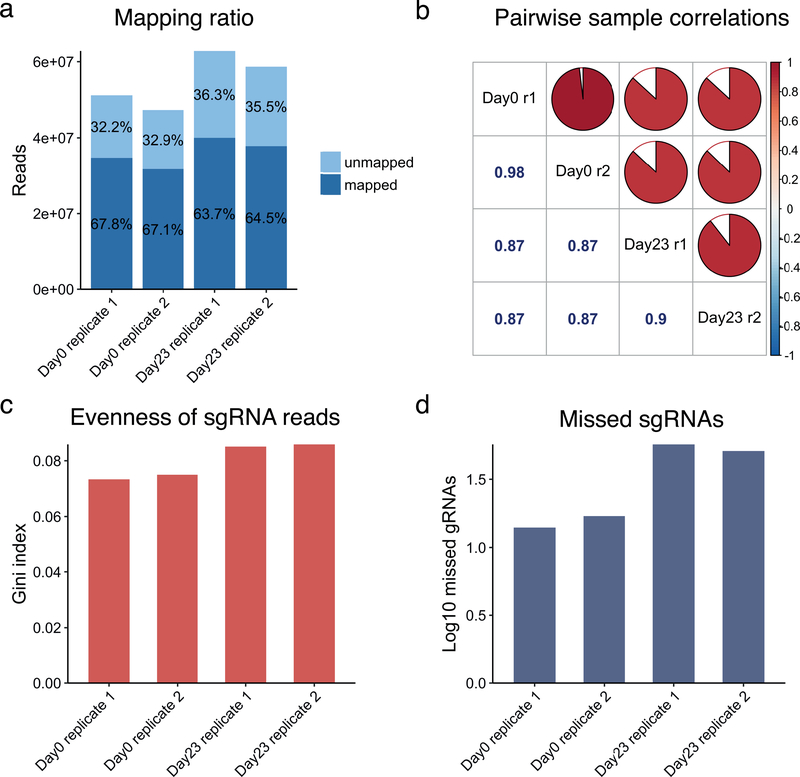
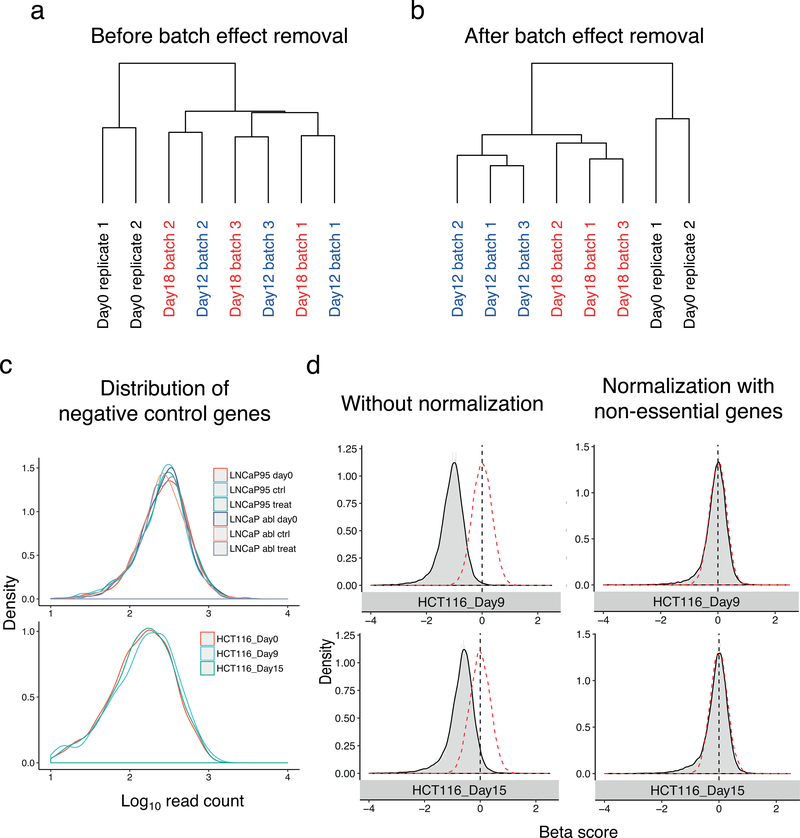
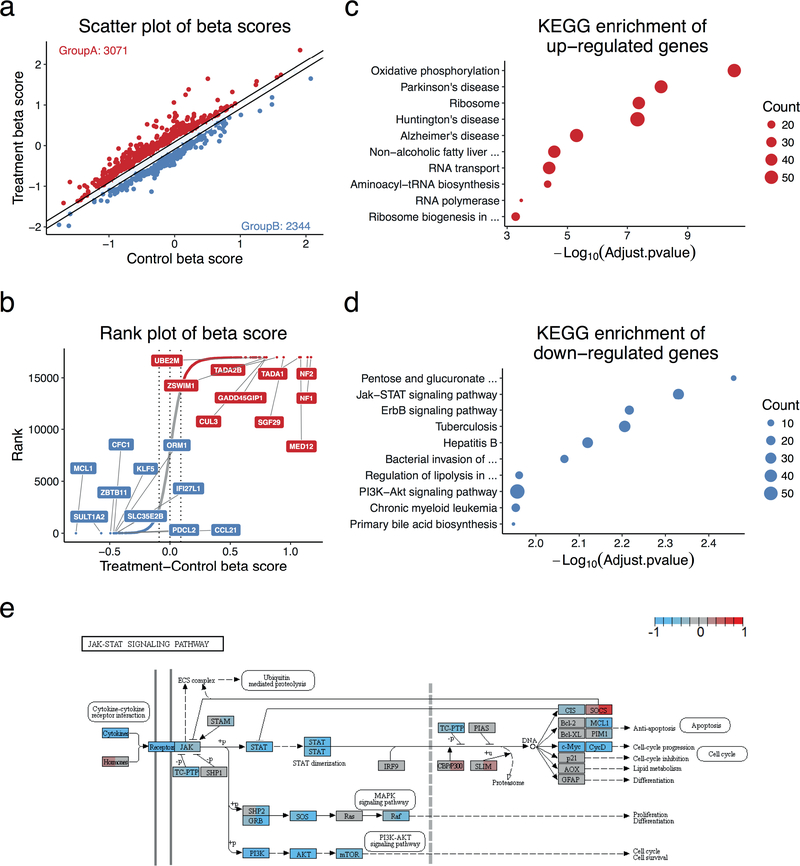
Genome-wide screening using CRISPR coupled with nuclease Cas9 (CRISPR-Cas9) is a powerful technology for the systematic evaluation of gene function. Statistically principled analysis is needed for the accurate identification of gene hits and associated pathways. Here, we describe how to perform computational analysis of CRISPR screens using the MAGeCKFlute pipeline. MAGeCKFlute combines the MAGeCK and MAGeCK-VISPR algorithms and incorporates additional downstream analysis functionalities. MAGeCKFlute is distinguished from other currently available tools by its comprehensive pipeline, which contains a series of functions for analyzing CRISPR screen data. This protocol explains how to use MAGeCKFlute to perform quality control (QC), normalization, batch effect removal, copy-number bias correction, gene hit identification and downstream functional enrichment analysis for CRISPR screens. We also describe gene identification and data analysis in CRISPR screens involving drug treatment. Completing the entire MAGeCKFlute pipeline requires ~3 h on a desktop computer running Linux or Mac OS with R support.


Figures

Figure 1.
Figure 1.. A schematic representation of CRISPR/Cas9 screen analysis using MAGeCKFlute.
Procedure step numbers described in the main text are shown to the left of the corresponding box. The FASTQ files or raw read count files (Table 4), a screen library file (Table 2), and a Design matrix (Table 5) are required as input for initial analysis through both MAGeCK and MAGeCK-VISPR. The following input components are optional: count table batch correction (which requires an otherwise optional batch matrix file) and CNV analysis and correction. Users have the option of analysing CRISPR screen data step-by-step with the individual MAGeCK modules (Option A, right branch) or with MAGeCK-VISPR, which combines all MAGeCK modules and additional quality control and visualization functions in a single script (Option B, left branch). FluteRRA and FluteMLE use the results generated with MAGeCK or MAGeCK-VISPR for downstream analyses, including pathway enrichment using GO and KEGG. Outputs of FluteRRA or FluteMLE include the beta score distribution and beta-score scatter plots.
Figure 2.
Figure 2.. Example Quality control assessment of CRISPR/Cas9 screen data.
All four samples analysed here are from a genome-wide CRISPR screen dataset generated from patient-derived Glioblastoma GBM stem-like cells (GSCs). These samples represent two conditions: Day0, initial time point of screen and Day23, after 23 days of culture. Replicate 1 and Replicate 2 are biological replicates. These results are generated by performing MAGeCK count. (a) Read counts and mapping percentages. The mapped read percentage should be greater than 65%. (b) pairwise sample correlations of read count, (c) Gini index, which measures read depth evenness within samples. (d) Number of missed sgRNAs.
Figure 3.
Figure 3.. Batch effect correction and normalization of read counts and beta scores from CRISPR screen data.
The data analysed here is a genome-wide CRISPR screen using HCT116 colorectal carcinoma cells harvested at several time points. Day 0, Day 12 and Day 18 were selected to demonstrate batch effect. Another two time points, Day 9 and Day 15, were selected to demonstrate negative normalization with non-essential genes. (a) Before and (b) after batch-effect correction of HCT116 CRIRSPR screen data using ComBat. The sgRNAs from several time points (Day 0, Day 12, and Day 18) were harvested and sequenced. Each time point contains more than 1 replicate, but the replicates were generated independently. Different batches are shown in different colours, and replicates are marked by number 1, 2, 3. (c) Density plot of read counts from gRNAs corresponding to negative control genes AAVS1, CCR5, and ROSA26 (top) and to non–essential genes (bottom). Data shown here is from the HCT116 genome-wide CRISPR screen and a LNCap dataset (Supplementary Data 4) which is a genome-wide CRISPR screen data and includes 2 cell lines, LNCap95 and LNCap abl. (d) Beta score distribution of HCT116 CRISPR screen samples before (left) and after (right) normalization using non-essential genes. Samples were harvested at two data points (Day 9 and Day 15). The red dashed line represents a normal distribution with a mean of zero and the same standard deviation as the original beta score. Black dashed line indicates the mean of the simulated normal distribution. After a correct normalization, the mean of beta score should be close to zero.
Figure 4.
Figure 4.. CRISPR/Cas9 screen analysis by MAGeCKFlute.
The data analysed here is a CRISPR screen in a breast melanoma cancer cell line, A375, treated with the BRAF protein kinase inhibitor vemurafenib (PLX). Data was processed with FluteMLE. (a) Scatterplot of treatment and control beta scores. The beta scores were normalized using the median of the beta scores of the core essential genes we compiled (Supplementary Data 2, Supplementary Method). The two diagonal lines indicate +/−1 standard deviation of the difference between treatment and control beta scores. Red dots (Group A) are genes whose beta score increased after treatment. Blue dots (Group B) are genes whose beta score decreased after treatment. (b) The genes are sorted based on the differential beta score, which is calculated by subtracting the control beta score from the treatment beta score. The colour scheme is the same as in panel a and dots between two diagonal lines are genes for which the beta score did not change significantly between different conditions. The top 10 enriched KEGG pathways with (c) positively (Red, Group A) and (d) negatively (Blue, Group B) selected genes. The p-value was calculated with the clusterProfile package that is based on the hypergeometric distribution. The size of each circle indicates the number of genes which are enriched in the corresponding function. (e) A visualization of treatment and control beta scores over the JAK-STAT signaling pathway generated by the Pathview package. The left and right portion of a gene-box represent control and treatment beta scores, respectively. Red indicates a positive beta score, blue indicates a negative beta score, and grey marks genes are neither positively nor negatively selected. The dashed vertical line in this specific pathway indicates the nuclear membrane.

References

    1. Cong L, et al. Multiplex genome engineering using CRISPR/Cas systems. Science 339, 819–823 (2013). - PMC - PubMed
    1. Gilbert LA, et al. Genome-Scale CRISPR-Mediated Control of Gene Repression and Activation. Cell 159, 647–661 (2014). - PMC - PubMed
    1. Konermann S, et al. Genome-scale transcriptional activation by an engineered CRISPR-Cas9 complex. Nature 517, 583–588 (2015). - PMC - PubMed
    1. Mali P, et al. RNA-guided human genome engineering via Cas9. Science 339, 823–826 (2013). - PMC - PubMed
    1. Wang T, Wei Jj Fau - Sabatini DM, Sabatini Dm Fau - Lander ES & Lander ES Genetic screens in human cells using the CRISPR-Cas9 system. 343, 80–84. - PMC - PubMed

Publication types

Substances