Review
. 2019 Mar 30:664:62-67.
doi: 10.1016/j.abb.2019.01.034. Epub 2019 Jan 30.

How myofilament strain and strain rate lead the dance of the cardiac cycle

Affiliations
Review

How myofilament strain and strain rate lead the dance of the cardiac cycle

Charles S Chung. Arch Biochem Biophys. .

Abstract

Movement of the myocardium can modify organ-level cardiac function and its molecular (crossbridge) mechanisms. This motion, which is defined by myocardial strain and strain rate (muscle shortening, lengthening, and the speed of these movements), occurs throughout the cardiac cycle, including during isovolumic periods. This review highlights how the left ventricular myocardium moves throughout the cardiac cycle, how muscle mechanics experiments provide insight into the regulation of forces used to move blood in and out of the left ventricle, and its impact on (and regulation by) crossbridge and sarcomere kinetics. We specifically highlight how muscle mechanics experiments explain how myocardial relaxation is accelerated by lengthening (strain rate) during late systole and isovolumic relaxation, a lengthening which has been measured in human hearts. Advancing and refining both in vivo measurement and ex vivo protocols with physiologic strain and strain rates could reveal important insights into molecular (crossbridge) kinetics. These advances could provide an improvement in both diagnosis and precise treatment of cardiac dysfunction.

Keywords: Diastole; Relaxation; Strain; Strain rate; Striated muscle; Systole.


Figures

Figure 1.
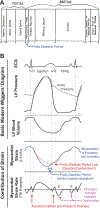
Figure 1.. Wiggers’ Diagrams with Strain and Strain Rate Signals.
A) Wiggers’ description of the consecutive phases of the cardiac cycle. Notably, a proto-diastolic period is described before isometric (now isovolumic) relaxation, i.e. before the closure of the aortic valve. (Reprinted with permission from [1]) B) A schematic of the modern Wiggers’ diagram typically includes left ventricular pressure and volume (often along with other parameters like heart sounds); here we include strain and strain rate. The pressure and volume signals can be measured using many methods including catheterization, ultrasound, MRI and angiography. Myocardial strain and strain rate traces are typically not included in the Wiggers’ diagram, but imaging (typically strain ultrasound and tissue tagged MRI) show that the myocardium is dynamic throughout the cardiac cycle. The Lo for strain is typically taken as the end diastolic length. In many (mostly healthy hearts, blue strain), a proto-diastolic period is seen, where shortening strain peaks, and the myocardium begins to relengthen before isovolumic relaxation begins. In many hearts with diastolic dysfunction, the peak strain is reduced and peak strain occurs near or after aortic valve closure, causing the proto-diastolic period to be lost (discussed in Section 2.2). Myocardial strain rate (as would be measured via Tissue Doppler Imaging of the mitral annulus in an apical view) reveals that the isovolumic periods are auxotonic (discussed in Section 1.1) and is commonly used to help diagnose diastolic dysfunction (discussed in Section 3).
Figure 2.
Figure 2.. An overview of in vivo ventricular motion throughout the cardiac cycle.
Motion is revealed by multiple imaging modalities such as ultrasound and tagged MRI. Insights from ex vivo mechanical studies and open questions are discussed throughout this Review.
Figure 3.
Figure 3.. Control of Relaxation Rate.
A-C. Load clamp experiments in intact cardiac muscles. The force and length traces in Panel A most closely mimic the pressure and volume traces in the Wiggers’ diagram. Brutsaert and others showed that myocardial lengthening strain (‘relaxation loading’) was necessary to modify the relaxation rate using the protocol shown in Panel B [33, 35]. In these works, the muscle was typically fully relengthened back to its diastolic length before relaxation. We showed later that lengthening was sufficient to modify the relaxation rate using protocols shown in Panel C by performing load clamps where the muscle was partially lengthened towards its diastolic length. We concluded that the relaxation rate, measured during end to end isometric relaxation, was dependent on the strain rate at end systole as shown in Panel D [26]. Note that three of the four points were all taken at the same afterload, but were either not relengthened (red), partially relengthened (purple), or fully relengthened (blue).

References

    1. Wiggers CJ, Am J Physiol 56 (1921) 415–438.
    1. Pombo JF, Troy BL, Russell RO Jr., Circulation 43 (1971) 480–490. - PubMed
    1. Folse R, Braunwald E, Circulation 25 (1962) 674–685. - PubMed
    1. Appleton CP, Firstenberg MS, Garcia MJ, Thomas JD, Cardiol Clin 18 (2000) 513–546, ix. - PubMed
    1. Redfield MM, Jacobsen SJ, Burnett JC Jr., Mahoney DW, Bailey KR, Rodeheffer RJ, Jama 289 (2003) 194–202. - PubMed

Publication types

LinkOut - more resources