. 2019 Jan;145(1):272.
doi: 10.1121/1.5087134.

Tympanic membrane surface motions in forward and reverse middle ear transmissions

Affiliations

Tympanic membrane surface motions in forward and reverse middle ear transmissions

Jeffrey Tao Cheng et al. J Acoust Soc Am. 2019 Jan.

Abstract

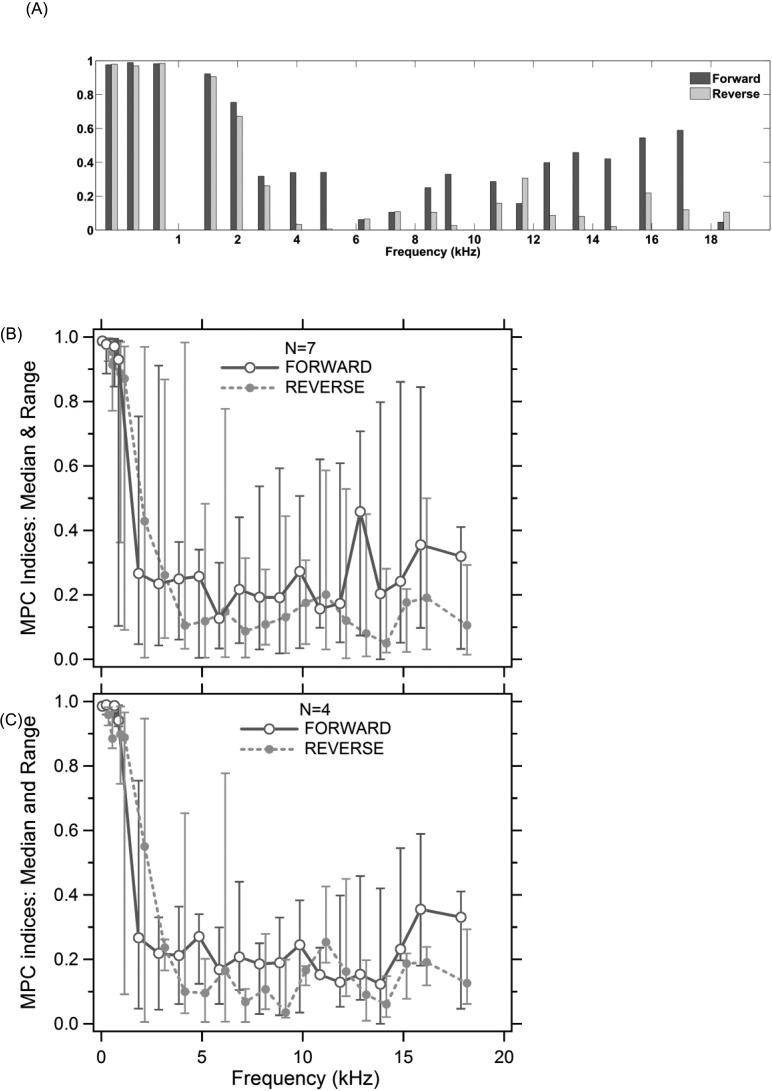
Characterization of Tympanic Membrane (TM) surface motions with forward and reverse stimulation is important to understanding how the TM transduces acoustical and mechanical energy in both directions. In this paper, stroboscopic opto-electronic holography is used to quantify motions of the entire TM surface induced by forward sound and reverse mechanical stimulation in human cadaveric ears from 0.25 to 18.4 kHz. The forward sound stimulus was coupled to an anatomically realistic artificial ear canal that allowed optical access to the entire TM surface, and the reverse mechanical stimulus was applied to the body of the incus by a piezo-electric stimulator. The results show clear differences in TM surface motions evoked by the two stimuli. In the forward case, TM motion is dominated by standing-wave-like modal motions that are consistent with a relatively uniform sound-pressure load over the entire TM surface. With reverse mechanical stimulation, the TM surface shows more traveling waves, consistent with a localized mechanical drive applied to the manubrium embedded in the TM. With both stimuli, the manubrium moves less than the rest of the TM, consistent with the TM acting like a compliant membrane rather than a stiff diaphragm, and also consistent with catenary behavior due to the TM's curved shape.


Figures

FIG. 1.
FIG. 1.
A schematic drawing of the experimental setup that pictures the middle ear of the temporal bone, the placement of the artificial ear canal, and the holographic measurement via the transparent glass window in the canal. In forward sound stimulation, tones are delivered to the lateral surface of the TM through a side tube near the artificial ear canal opening. In reverse mechanical stimulation, a small piezoelectric stack is used to drive the body of incus through the open epitympanum of the bone. A probe microphone is inserted through the opening end of the artificial ear canal to monitor sound pressure levels near the TM annulus during the experiment.
FIG. 2.
FIG. 2.
Normalized umbo displacements relative to ear canal pressures from all seven temporal bones quantified in this study through holography, in (A) forward sound stimulation; (B) reverse mechanical stimulation. Only the results of displacement magnitude are shown in this plot.
FIG. 3.
FIG. 3.
Comparisons of TM surface motions from one of the human temporal bones (TB7) quantified by stroboscopic holography between forward and reverse stimulations, at four different frequencies: (A) 784 Hz, (B) 3970 Hz, (C) 7304 Hz, and (D) 15 784 Hz. TM motions induced by forward sound stimulation are shown in the left column, and TM motions by reverse mechanical stimulation are shown in the right column. The top panel of each plot shows the magnitude ratio relative to the umbo motion in dB, and bottom panels show the phase ratio relative to the umbo motion in cycles. Displacement values are coded in colors as shown in color bar to the right. The TM annulus (solid lines) and the manubrium (dashed lines) are outlined in white.
FIG. 4.
FIG. 4.
Comparisons of measured TM motion along two diameters across the TM surface with the two stimulations (forward in black solid and reverse in gray dotted lines) from the same bone (TB7) as in Fig. 3 and at the same four frequencies: (A) 784 Hz, (B) 3970 Hz, (C) 7304 Hz, and (D) 15 784 Hz. The two schematic drawings at the top panel of (A) show two diameters (dotted lines) along which the displacements are plotted. The top panel of each plot shows displacement magnitude ratios (relative to the umbo) in dB, and the bottom panel shows phase (relative to the umbo) in cycles. The x axis represents the distance from the umbo (x = 0, marked by the vertical dotted line) along the two diameters. The horizontal dotted lines mark magnitudes of 0 dB and angles of 0 cycles.
FIG. 5.
FIG. 5.
Comparisons of effective areas of the TM computed in forward and reverse stimulations from seven temporal bones. (A) Effective area in forward stimulation; (B) effective area in reverse stimulation; (C) comparison of mean effective areas between forward (in black) and reverse (in gray) stimulation and their standard deviations.
FIG. 6.
FIG. 6.
Displacement phase relative to the umbo averaged over the TM surface in seven temporal bones. (A) Forward stimulation. (B) Reverse stimulation. (C) Comparison of the mean and standard deviation of the TM surface motion phase relative to the umbo between two stimulations (forward in solid lines with open circles, and reverse in dashed lines with filled circles). In all plots, a thin dotted horizontal line marks the 0 phase value.
FIG. 7.
FIG. 7.
Fraction of TM surface motion (A) in-phase, (B) half-a-cycle-out-of-phase, and (C) quadrature phase with the umbo motion. Mean and standard deviation of the fraction of the TM area in forward (solid-lines and open circles) and reverse (dashed lines and filled circles) are compared across a wide frequency range between 100 and 20 000 Hz. The range indicators describe + and – one standard deviation.
FIG. 8.
FIG. 8.
Argand diagrams of the TM surface motion at all measured TM surface points from TB7 in forward (A and C) and reverse (B and D) stimulations, at two selected frequencies (784 and 15 784 Hz).
FIG. 9.
FIG. 9.
(Color online) Modified rose map plots of TM surface motions at all measurement points from TB7 in forward and reverse stimulations at four frequencies. (A) and (B) 784 Hz; (C) and (D) 3970 Hz; (E) and (F) 7304 Hz; (G) and (H) 15 784 Hz. The circles describe contours of the fraction of the TM area with specific values of phase and magnitude relative to the umbo. The colors code the magnitude relative to the maximum ratio of point and umbo displacement. The extent of the colors within each phase range codes the fraction of points within a specific magnitude range in that phase range.
FIG. 10.
FIG. 10.
(A) Comparison of MPC index in TB7 at 20 frequencies between forward and reverse stimulations. (B) Median MPC correlations in forward and reverse stimulations from all seven bones. (C) Median MPC correlations in forward and reverse stimulations from reduced number of bones (N = 4).
FIG. 11.
FIG. 11.
(Color online) Maps of the location of the maximum displacement magnitude in each of the seven bones across three frequency ranges in forward [(A), (B), and (C)] and reverse [(D), (E), and (F)] stimulations. In Forward stimulation, the location of the maximum is nearly identical in three bones (6, 7, and 13) at all four low frequencies. The other four bones show similar Forward stimulation maxima in at least three of the four low frequencies, but the location differs between the bones.

References

    1. Chan, T. F. , and Vese L. A. (2001). “ Active contours without edges,” IEEE Trans. Image Process. 10(2), 266–277.10.1109/83.902291 - DOI - PubMed
    1. Cheng, J. T. , Aarnisalo, A. A. , Harrington, E. , Hernandez-Montes M. S., Furlong, C. , Merchant, S. N. , and Rosowski, J. J. (2010). “ Motion of the surface of the human tympanic membrane measured with stroboscopic holography,” Hear. Res. 263, 66–77.10.1016/j.heares.2009.12.024 - DOI - PMC - PubMed
    1. Cheng, J. T. , Hamade, M. A. , Harrington, E. , Furlong, C. , Merchant, S. N. , and Rosowski, J. J. (2013). “ Wave motion on the surface of the human tympanic membrane: Holographic measurement and modeling analysis,” J. Acoust. Soc. Am. 133(2), 918–937.10.1121/1.4773263 - DOI - PMC - PubMed
    1. Cheng, J. T. , Ravicz, M. , Guignard, J. , Furlong, C. , and Rosowski, J. J. (2015). “ The effect of ear canal orientation on tympanic membrane motion and the sound field near the tympanic membrane,” J. Assoc. Res. Otolaryngol. 16(4), 413–432.10.1007/s10162-015-0516-x - DOI - PMC - PubMed
    1. Curtis, J. (2007). “ Wind Rose data,” Natural Resources Conservation Service, https://www.wcc.nrcs.usda.gov/climate/windrose.html (Last viewed January 9, 2019).

Publication types